Vea también

 08.05.2025 06:05 AM
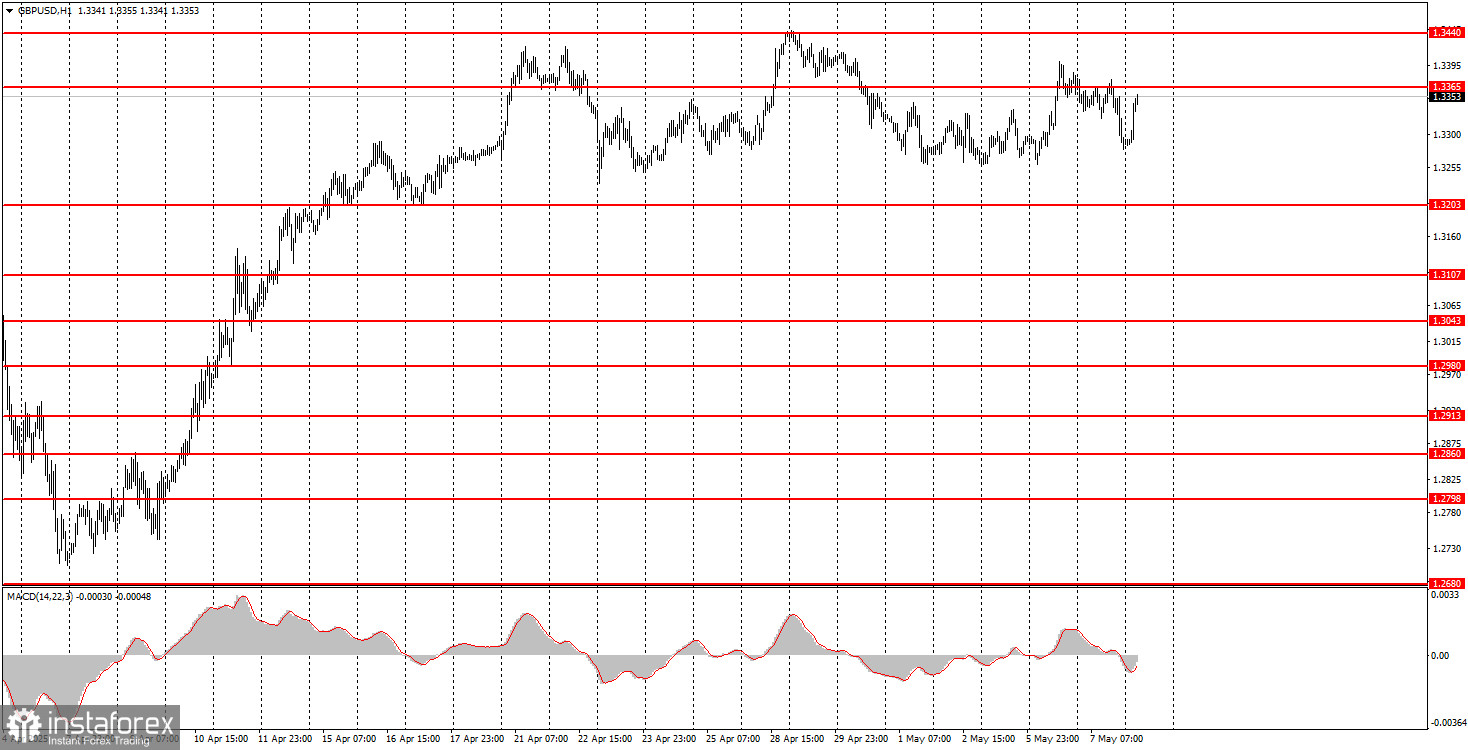
The GBP/USD pair showed no notable movements on Wednesday. After Jerome Powell stated the need for more time to assess the full economic impact of Trump's tariffs, the U.S. dollar predictably strengthened. But how much was this growth? Just 50 pips. By Thursday morning, the British pound had fully recovered all of the evening's losses. This is precisely what we warned about. First, the Federal Reserve meeting had no lasting impact, even though Powell took a slightly more hawkish tone than traders had expected. Second, waiting until Thursday to see the market's complete reaction would be necessary. As we can now see, the dollar ultimately gained no traction from another hawkish Fed meeting. Thus, the flat trend in GBP/USD continues, and the market remains focused on whether Donald Trump escalates or de-escalates the trade conflict.
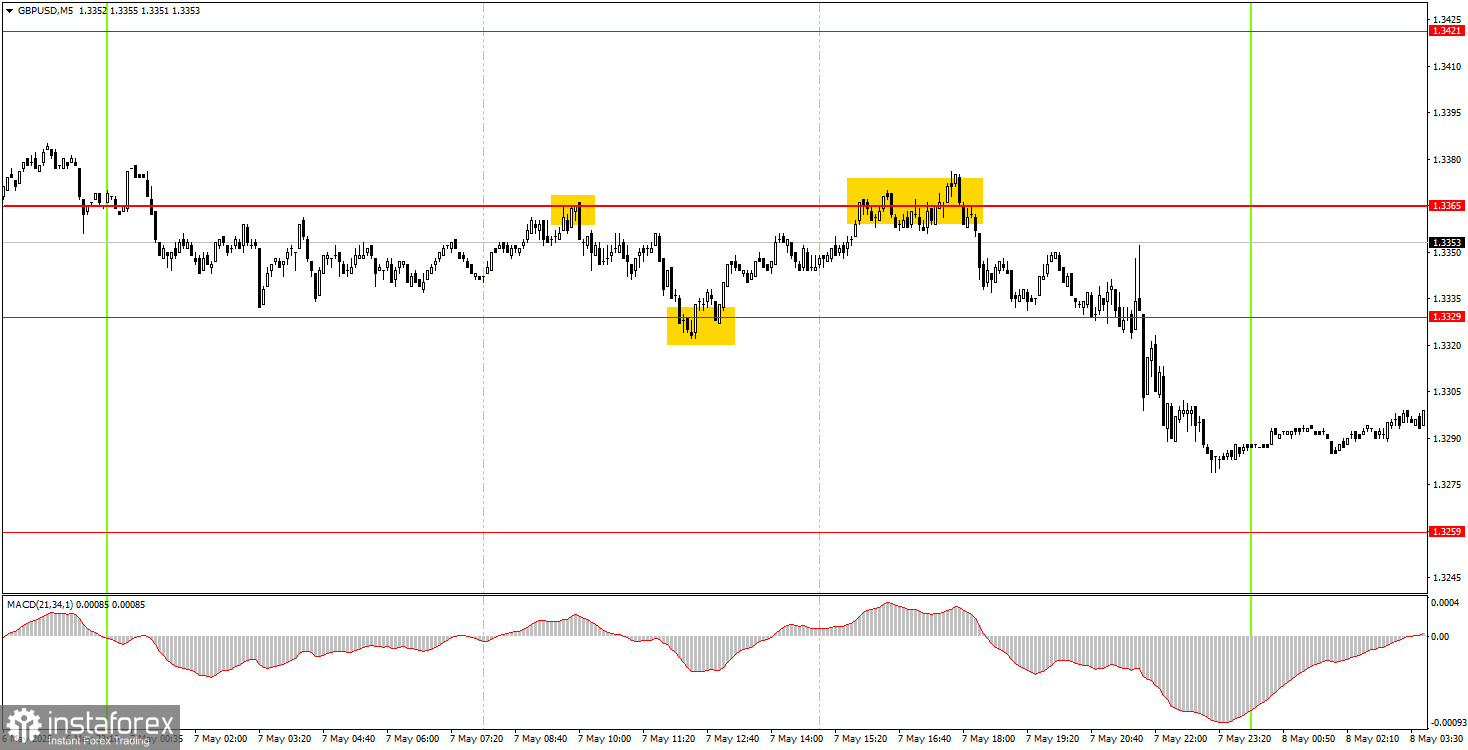
On the 5-minute chart, three trading signals were formed throughout the day between the 1.3329 and 1.3365 levels. The distance between these levels is just 35 pips, meaning that opening trades on bounces between them made little sense, as the potential profit was smaller than the possible loss. Nevertheless, in all three cases, the nearest targets were reached, so any novice traders taking positions could have made a modest profit of a few dozen pips. Still, we remind you that the market is currently much more chaotic and random than logical and structured.
On the hourly chart, GBP/USD continues to follow only one influence—Donald Trump. As a result, the pound continues to rise steadily, or at least remains consistently high. Thus, future movement in the pair depends solely on the American president and his decisions, not on any other factor. Perhaps in the future, the market's attitude toward news will change, but so far, there are no signs of that happening.
On Thursday, the GBP/USD pair could trade in either direction. Even the upcoming Bank of England meeting may not have any impact, just as the market ignored the Fed's meeting yesterday.
On the 5-minute chart, trading can be conducted based on the following levels: 1.2848–1.2860, 1.2913, 1.2980–1.2993, 1.3043, 1.3102–1.3107, 1.3145–1.3167, 1.3203, 1.3259, 1.3329, 1.3365, 1.3421–1.3440, 1.3488, 1.3537, 1.3580–1.3598. A Bank of England meeting is scheduled for Thursday in the UK, where a rate cut decision is likely—a development that's been known at least since the beginning of this week. If the market were inclined to sell the pound because of it, it would likely have done so already.
Support and Resistance Levels: These are target levels for opening or closing positions and can also serve as points for placing Take Profit orders.
Red Lines: Channels or trendlines indicating the current trend and the preferred direction for trading.
MACD Indicator (14,22,3): A histogram and signal line used as a supplementary source of trading signals.
Important Events and Reports: Found in the economic calendar, these can heavily influence price movements. Exercise caution or exit the market during their release to avoid sharp reversals.
Forex trading beginners should remember that not every trade will be profitable. Developing a clear strategy and practicing proper money management are essential for long-term trading success.


