Vea también

 28.05.2025 06:41 AM
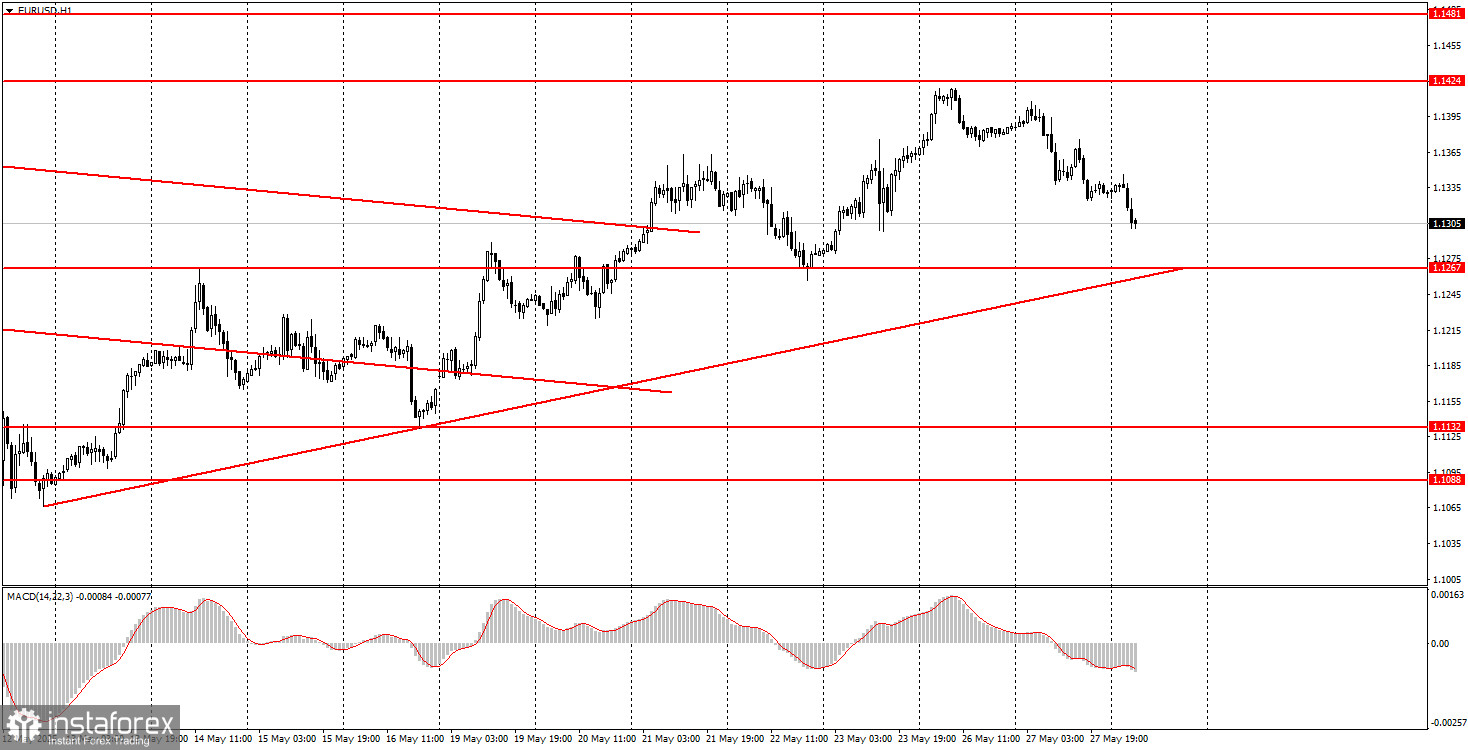
On Tuesday, the EUR/USD currency pair continued its downward movement, which had begun on Monday. The dollar continued to strengthen the night into Wednesday; however, this shouldn't be considered a celebration. The reversal of Donald Trump's decision to raise tariffs on the European Union from June 1st positively impacted the dollar. However, recall how briefly the dollar strengthened when the U.S. and China agreed to reduce tariffs by 115%. It didn't last long.
Yesterday, the report on durable goods orders also supported the U.S. dollar, which was less disappointing than expected. As a result, the dollar has been rising for two full days, but this by no means indicates that the four-month uptrend is over. From a technical perspective, the uptrend remains intact even on the hourly timeframe. A rebound from the trendline and the 1.1267 level could result in the upward movement's resumption.
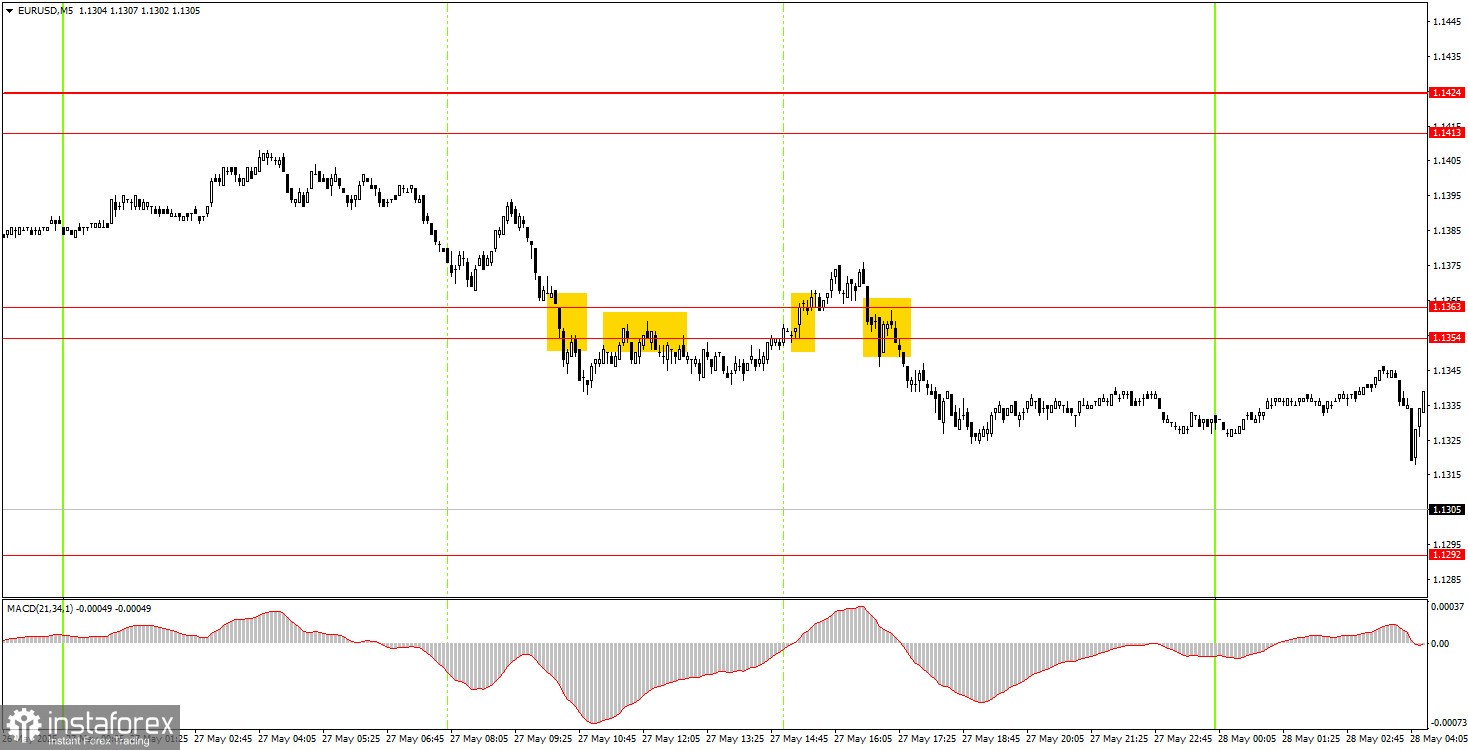
On the 5-minute timeframe, the pair didn't show the best movements on Tuesday. Although there was a general downward trend throughout the day, it could have been avoided if not for the durable goods orders report. At the beginning of the U.S. session, the price broke above the 1.1354–1.1363 zone, but immediately after the report's release, the dollar's rally resumed. As a result, almost all signals turned out to be either false or late. The macroeconomic and fundamental backdrop throughout the day overshadowed the technical signals.
The EUR/USD pair retains a bullish trend on the hourly timeframe. It appears the uptrend, which began when Trump became president, is likely to continue. At this point, just the fact that Trump is the U.S. president is enough for the market to flee from the dollar. The market sees few alternatives when Trump issues threats, sets ultimatums and imposes or raises tariffs.
On Wednesday, the EUR/USD pair may continue its downward correction, but breaking below the trendline and the 1.1267 level will require strong justification. We anticipate that an upward reversal could occur around this level and the trendline.
On the 5-minute TF, the following levels should be considered: 1.0940-1.0952, 1.1011, 1.1088, 1.1132-1.1140, 1.1198, 1.1267-1.1292, 1.1354-1.1363, 1.1413-1.1424, 1.1474-1.1481, 1.1513, 1.1548, 1.1571, 1.1607-1.1622. No significant economic data or events are scheduled in the Eurozone. In the U.S., the FOMC meeting minutes will be released in the evening, but this is considered a secondary document. The market currently ignores the Federal Reserve's monetary policy, so the minutes are unlikely to have a significant impact.
Support and Resistance Levels: These are target levels for opening or closing positions and can also serve as points for placing Take Profit orders.
Red Lines: Channels or trendlines indicating the current trend and the preferred direction for trading.
MACD Indicator (14,22,3): A histogram and signal line used as a supplementary source of trading signals.
Important Events and Reports: Found in the economic calendar, these can heavily influence price movements. Exercise caution or exit the market during their release to avoid sharp reversals.
Forex trading beginners should remember that not every trade will be profitable. Developing a clear strategy and practicing proper money management are essential for long-term trading success.


