Vea también

 30.05.2025 06:37 AM
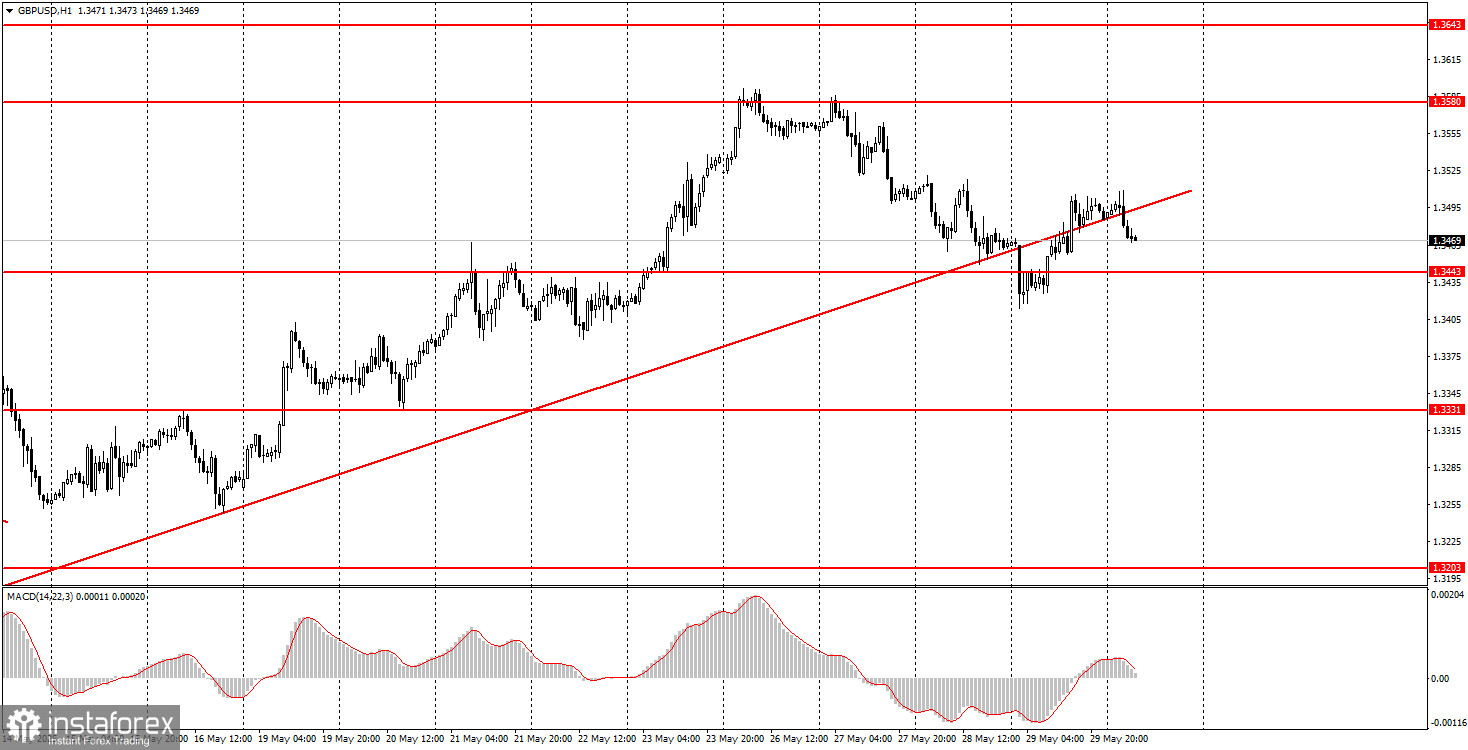
On Thursday, the GBP/USD pair showed movements similar to the EUR/USD pair but with lower volatility. The ascending trendline was breached, so from a technical point of view, a further decline in the pair and a strengthening of the dollar should be expected. Are there fundamental reasons for this? It's a tough question because the market continues ignoring many factors favoring the U.S. dollar. Yesterday, it became known that the court suspended Donald Trump's tariffs against half of the world's countries, but by the evening, the court had also suspended its decision to lift Trump's tariffs. Thus, the situation with the Global Trade War has not changed. From the current levels, the dollar can also continue its decline since not much is needed for that right now. It's best to rely on technical signals and setups because it is extremely difficult to understand which direction the market favors.
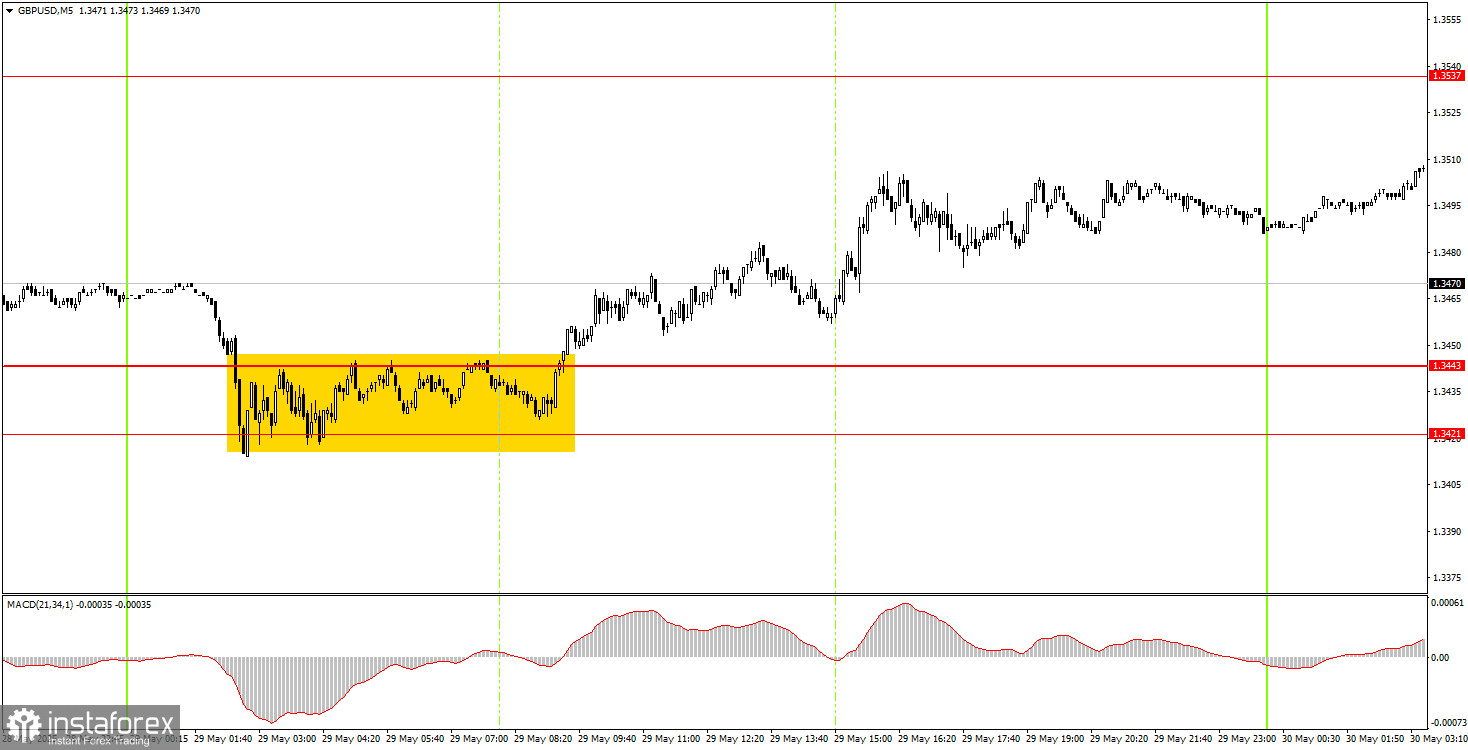
On Thursday, a good trading signal was generated in the 5-minute timeframe. At the beginning of the European trading session, the price broke out of the 1.3421–1.3443 area, so novice traders could have opened long positions. The British pound continued to rise for the rest of the day, although not too strongly. It didn't reach the nearest target, so the long position could have been closed manually anywhere in the evening.
In the hourly timeframe, the GBP/USD pair continues to follow developments around Donald Trump and remains quite skeptical about his policies. Some signs of easing trade tensions are present, but the market does not feel a surge of optimism about this. The dollar strengthened this week, but it is merely a technical correction that could continue. We would not risk declaring a full-fledged dollar trend even after breaking the trendline.
The GBP/USD pair might resume moving south on Friday since the trendline was breached. However, few fundamental factors support such a movement. We remain skeptical about the dollar's growth, but at the moment, it's better to trade based on technical factors.
For the 5-minute timeframe, trading levels to consider are 1.2913, 1.2980–1.2993, 1.3043, 1.3102–1.3107, 1.3203–1.3211, 1.3259, 1.3329–1.3331, 1.3421–1.3443, 1.3537, 1.3580–1.3592, 1.3652–1.3660, and 1.3695.
No significant events are scheduled for Friday in the UK, and in the U.S., reports on personal income and spending, the PCE price index, and the University of Michigan Consumer Sentiment Index will be released. We do not believe these reports will provoke a strong market reaction.
Support and Resistance Levels: These are target levels for opening or closing positions and can also serve as points for placing Take Profit orders.
Red Lines: Channels or trendlines indicating the current trend and the preferred direction for trading.
MACD Indicator (14,22,3): A histogram and signal line used as a supplementary source of trading signals.
Important Events and Reports: Found in the economic calendar, these can heavily influence price movements. Exercise caution or exit the market during their release to avoid sharp reversals.
Forex trading beginners should remember that not every trade will be profitable. Developing a clear strategy and practicing proper money management are essential for long-term trading success.


