Vea también

 17.06.2025 08:42 AM
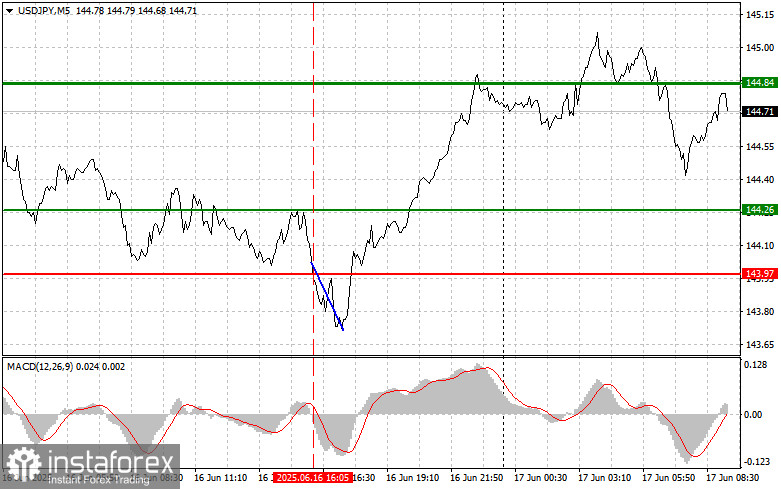
The test of the 143.97 level coincided with the moment when the MACD indicator had just begun to move downward from the zero line, confirming a valid entry point for selling the dollar. As a result, the pair dropped by 20 pips, after which the pressure eased.
The Japanese yen barely reacted to the Bank of Japan's decision. Today, the BoJ kept its interest rate unchanged and revealed a plan to slow its exit from the bond market starting next year as a precaution following increased market volatility.
Governor Kazuo Ueda's policy board maintained the benchmark rate at 0.5% after the two-day meeting on Tuesday. In a widely expected move, the central bank announced that it would reduce the pace of bond purchases from £400 billion per month to £200 billion per quarter (approx. $1.34 billion) starting in the next fiscal year.
This decision, largely anticipated by the market, comes after a series of mixed economic indicators that prompted a wait-and-see stance. Despite rising inflation, the BoJ continues its cautious approach, arguing that steady wage growth and domestic demand provide support.
For intraday strategy, I will focus primarily on implementing Scenarios #1 and #2.
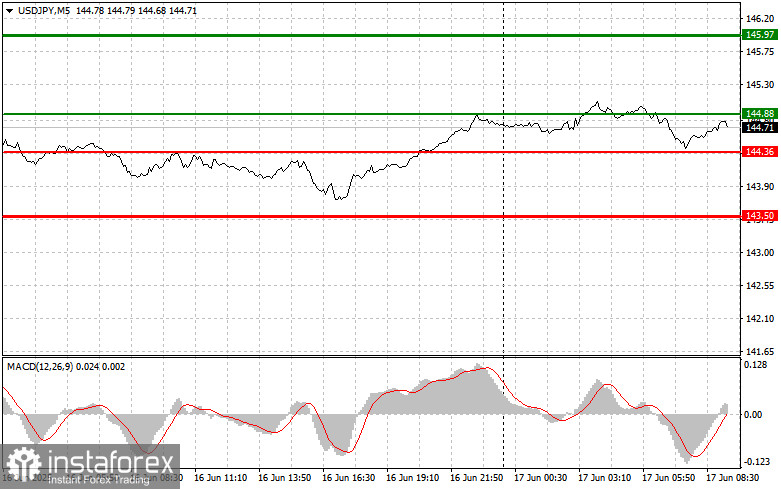
Scenario #1: I plan to buy USD/JPY today at the 144.88 entry level (green line on the chart), targeting a rise toward 145.97 (thicker green line). Around 145.97, I plan to exit long positions and open short positions, aiming for a 30–35 pip reversal. It's best to return to buying the pair during pullbacks or significant corrections in USD/JPY.
Important: Before buying, ensure the MACD is above the zero line and starting to rise.
Scenario #2: I also plan to buy USD/JPY if the price tests 144.36 twice in a row while the MACD indicator is in oversold territory. This would limit the pair's downside potential and prompt a bullish reversal. A rise toward 144.88 and 145.97 can be expected.
Scenario #1: I will sell USD/JPY only after the price breaks below 144.36 (red line on the chart), which should lead to a quick drop. The main target for sellers will be 143.50, where I will exit shorts and immediately open buy positions, targeting a 20–25 pip bounce.
Important: Before selling, make sure the MACD is below the zero line and just beginning to decline.
Scenario #2: I also plan to sell USD/JPY if the 144.88 level is tested twice while the MACD indicator is in overbought territory. This would limit the upside potential and likely cause a downward reversal. A decline toward 144.36 and 143.50 may follow.