
Vea también


 14.10.2026 08:15 AM
The daily timeframe chart for Bitcoin (#Bitcoin) shows price action currently centered around the 83,401.09 level. The price is maintaining its overall structure within ascending price channels, following a period of sideways, corrective volatility after touching levels near the upper resistance.
Technical Analysis and Price Action
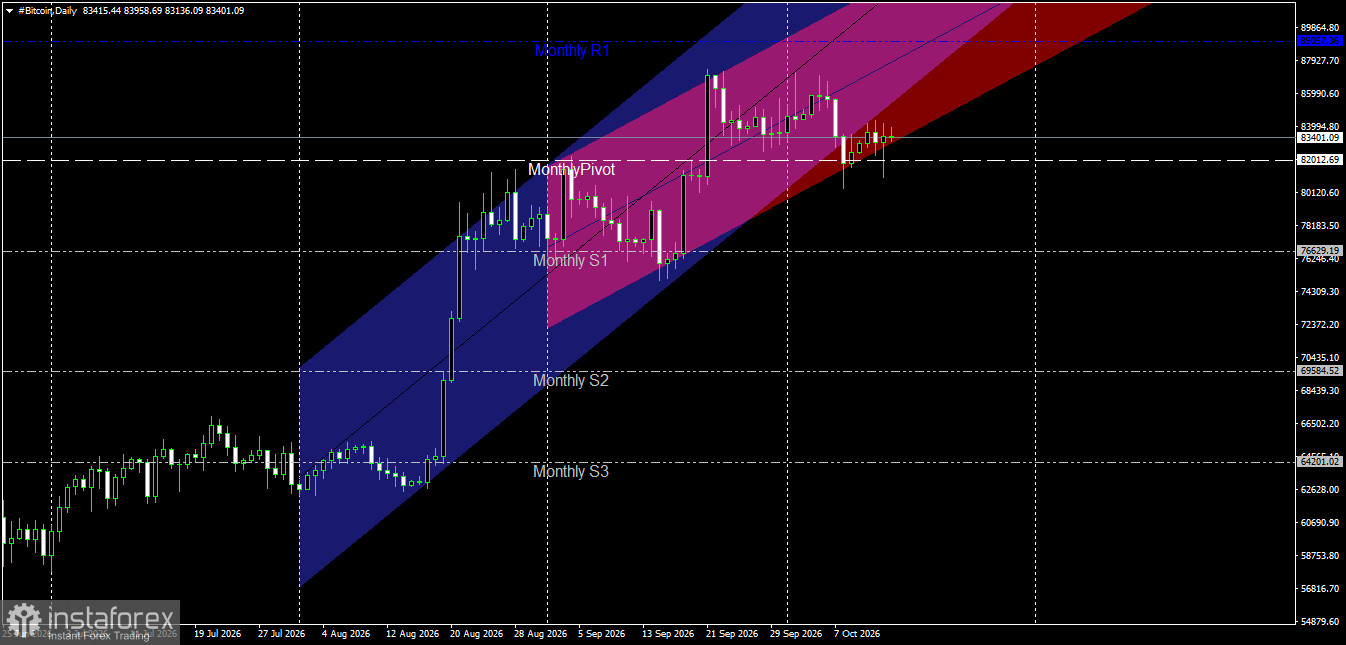
Price Channel Structure: The price is moving within a primary ascending channel (blue) and an accelerated secondary ascending channel (pink/red). Notably, the price is currently approaching a test of the secondary channel's lower boundary and the primary channel's midline; this highlights the area's importance as a vital technical support zone that sustains the medium-term positive trend.
Interaction with Monthly Pivot Levels: The price is holding above the Monthly Pivot level at 82,012.69, which has transformed into a key support line preventing a downward slide. Conversely, the price is trading below upper resistance levels—most notably the first monthly resistance (Monthly R1) at 89,057.36—suggesting that current trading is characterized by consolidation and a test of buying strength.
Key Support and Resistance Levels
Key Resistance Levels:
Resistance 1: 85,000.00 – 86,000.00 (previous intraday peak zones).
Resistance 2: 89,057.36 (Monthly R1 resistance level). Key Resistance: 92,000.00 and above (upper boundary of the main ascending channel).
Key Support Levels:
First Support: 82,012.69 (Monthly Pivot).
Second Support: 76,629.19 (Monthly S1).
Main Support: 69,584.52 (Monthly S2).
Price Action Outlook and Trading Recommendations
Bullish Scenario (Primary):
A positive trend is likely as long as the price remains stable above the Monthly Pivot (82,012.69) and above the lower boundary of the ascending channel.
Recommendation: Buy upon the appearance of bullish reversal signals from current support levels or near the Monthly Pivot.
Technical Targets: Target the 86,000.00 area first, then extend towards the first monthly resistance at 89,057.36.
Stop Loss: A daily close below 81,000.00.
Bearish Correction Scenario (Alternative):
Triggered if the price breaks the Monthly Pivot (82,012.69) and drops below it with a clear daily candle.
Confirmation Condition: Breaking the 82,012.69 level and exiting the ascending channel.
Technical Targets: Downward correction extending to target the first monthly support at 76,629.19.
The 4-hour (H4) chart for Bitcoin (#Bitcoin) shows the price currently trading at the 83,428.32 level. The price is attempting to stabilize and recover following a recent sharp decline that targeted levels near the first weekly support (Weekly S1) at 80,381.74.
Technical Analysis and Price Action
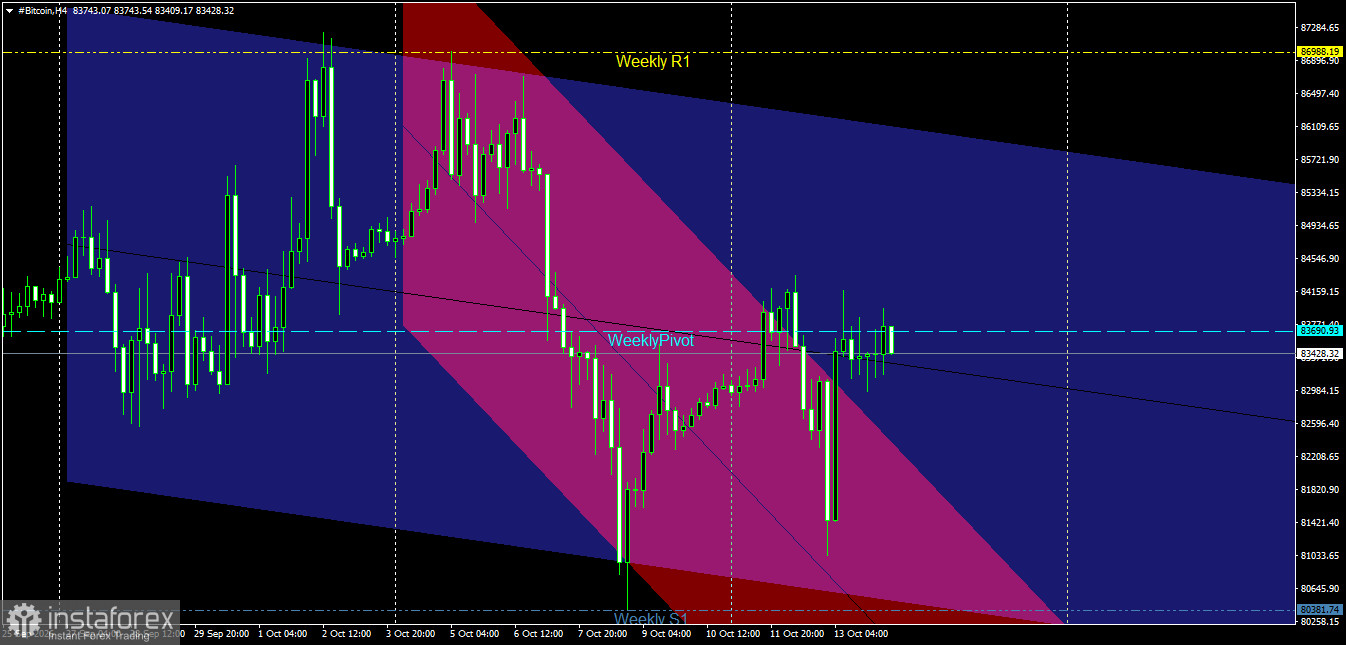
Price Channel Structure: Bitcoin is moving within a steep minor bearish channel (pink/red) that intersects with a broader major channel (blue). Notably, the price rebounded positively from a local low recorded below the 81,000.00 level—near the lower boundary of the pink channel—and is now trading back near the structural midline of the major channel.
Interaction with Pivot Levels: The price is currently fluctuating just below the Weekly Pivot point, located at 83,690.93. This level acts as a pivotal intraday resistance barrier; successfully holding above it would allow room for further upside movement, whereas remaining below it maintains selling pressure within the bearish channel.
Key Support and Resistance Levels
Key Resistance Levels:
Resistance 1: 83,690.93 (Weekly Pivot).
Resistance 2: 84,546.90 – 85,721.90 (Previous intraday peak zones within the blue channel). Pivot Resistance: Level 86,988.19 (Weekly R1).
Key Support Levels:
Support 1: Levels 82,596.40 – 82,984.15 (near-term intraday lows).
Support 2: Levels 81,421.40 – 81,820.90 (significant intraday support barrier).
Key Support: Level 80,381.74 (Weekly S1 and the channel's lower boundary).
Price Action Outlook and Scenarios
Bullish Corrective Scenario (Primary scenario upon breakout):
Triggered by a confirmed breakout above the Weekly Pivot (83,690.93) and a sustained close above it via a strong 4-hour candle.
Expected Path: Continuation of the bullish recovery wave, targeting the 84,546.90 area first, followed by an extension toward 85,721.90 to test the upper boundary of the sub-channel.
Recommendation: Buy following a confirmed 4-hour candle close above 83,690.93.
Stop Loss: 4-hour candle close below 82,596.40.
Bearish Scenario (Alternative):
Triggered if the price fails to break above the Weekly Pivot (83,690.93) and reverses downward from that level. Expected Path: A renewed decline targeting nearby support levels at 82,596.40; should selling pressure intensify, the pullback could extend toward 80,381.74 (Weekly S1).
Recommendation: Sell, provided resistance at 83,690.93 holds and a bearish reversal candle appears.
Risk Management
Trading amidst current movements between pivot lines and structural levels requires strict adherence to capital management protocols. Risk exposure should be limited to a maximum of 1%–2% per trade to protect the account against sudden volatility.


