Vea también

 10.10.2025 10:55 AM
Trend Analysis (Fig. 1).
On Friday, from the level of 1.1556 (yesterday's daily candle close), the market may continue to move downward toward the target of 1.1529 – the lower boundary of the Bollinger Bands indicator (black dotted line). When testing this line, a pullback upward is possible with a target of 1.1556 – the historical support level (blue dotted line).
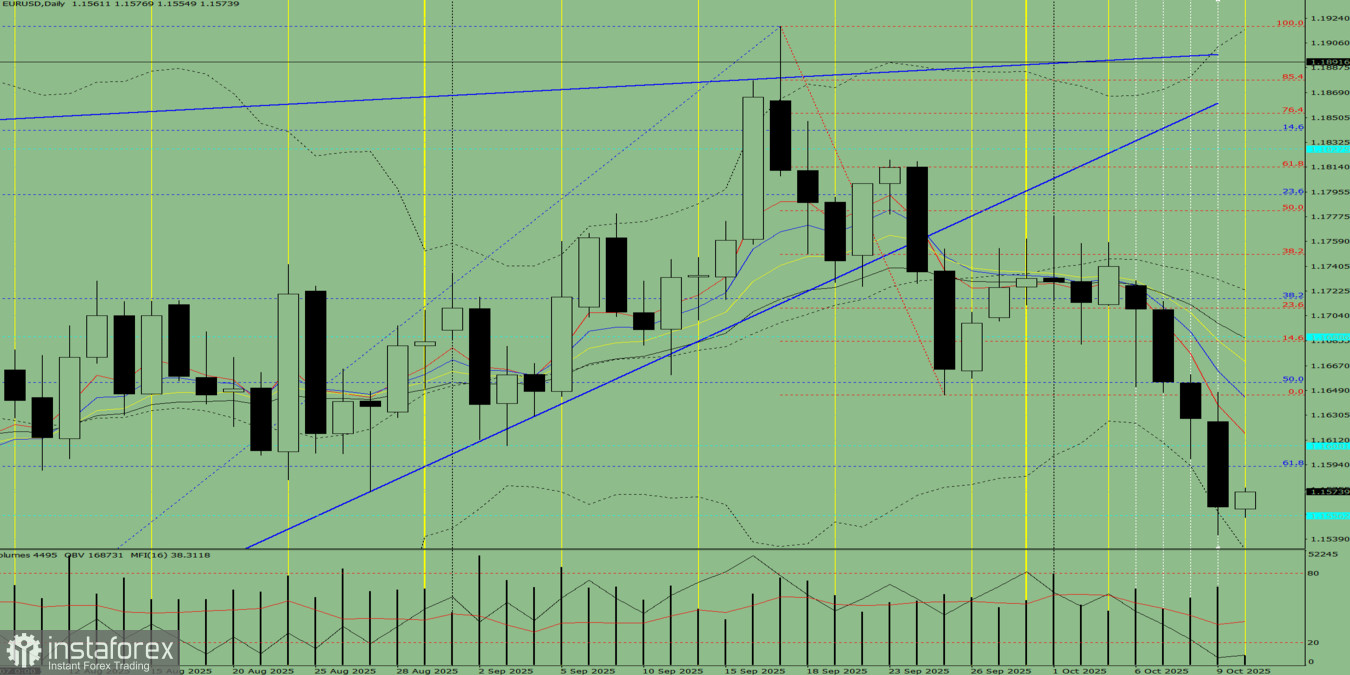
Fig. 1 (daily chart).
Comprehensive Analysis:
General conclusion: downward trend.
Alternative scenario: Today, from the level of 1.1556 (yesterday's daily candle close), the price may continue to move downward with a target of 1.1542 – the lower fractal (daily candle from October 9, 2025). When testing this level, a pullback upward is possible with a target of 1.1556 – the historical support level (blue dotted line).
You have already liked this post today
*El análisis de mercado publicado aquí tiene la finalidad de incrementar su conocimiento, más no darle instrucciones para realizar una operación.


