Vea también

 15.01.2026 07:54 PM
Trade Review and Trading Advice for the Japanese Yen
The test of the 158.70 price level occurred at a time when the MACD indicator had already moved significantly above the zero line, which limited the pair's upward potential. For this reason, I did not buy the dollar.
The number of people filing initial jobless claims in the United States is expected to decline compared with the previous week. A steady decrease in this figure may indicate a return of economic stability. Strong data could partially support the dollar's rise against the yen. Next comes the Philadelphia Fed Manufacturing Index, which is a leading indicator of the health of the manufacturing sector. Market participants will closely analyze this index to forecast economic growth in the country. The main focus, however, will be on speeches by Federal Open Market Committee members Bostic and Barkin. Investors will listen carefully for signals about possible changes in interest rates and the quantitative easing program. Particular attention will be paid to their views on the future course of rate cuts and the expansion of quantitative easing.
As for the intraday strategy, I will rely more on the implementation of Scenarios No. 1 and No. 2.

Buy Signal
Scenario No. 1: I plan to buy USD/JPY today if the price reaches the entry point around 158.75 (thin green line on the chart), with a target of growth toward the 159.29 level (thicker green line on the chart). Around 159.29, I will exit long positions and open short positions in the opposite direction (aiming for a 30–35 point move in the opposite direction from that level). A rise in the pair can be expected in continuation of the trend.Important: Before buying, make sure that the MACD indicator is above the zero line and is just beginning to rise from it.
Scenario No. 2: I also plan to buy USD/JPY today in the event of two consecutive tests of the 158.35 price level while the MACD indicator is in the oversold area. This will limit the pair's downward potential and lead to a reversal upward. Growth toward the opposite levels of 158.75 and 159.29 can be expected.
Sell Signal
Scenario No. 1: I plan to sell USD/JPY today after a break below the 158.35 level (red line on the chart), which would lead to a rapid decline in the pair. The key target for sellers will be the 157.94 level, where I will exit short positions and also open long positions in the opposite direction (aiming for a 20–25 point move in the opposite direction from that level). Pressure on the pair may return today in the event of a dovish Fed stance.Important: Before selling, make sure that the MACD indicator is below the zero line and is just beginning to decline from it.
Scenario No. 2: I also plan to sell USD/JPY today in the event of two consecutive tests of the 158.75 price level while the MACD indicator is in the overbought area. This will limit the pair's upward potential and lead to a reversal downward. A decline toward the opposite levels of 158.35 and 157.94 can be expected.
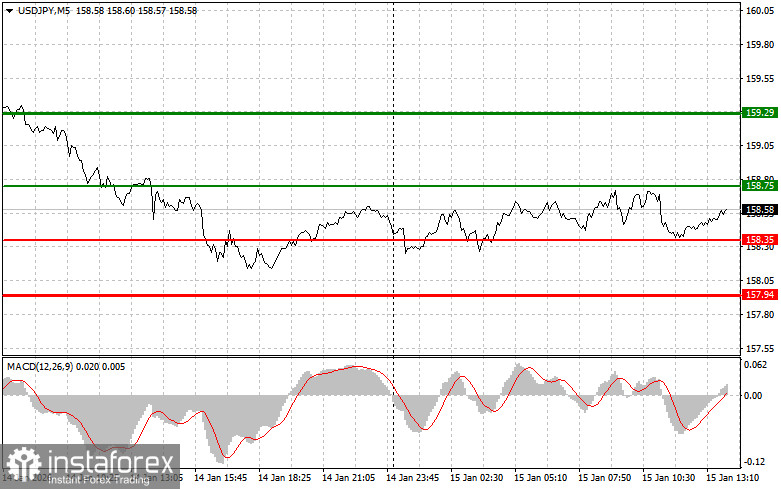
What's on the Chart:
Important. Beginner Forex traders should make market entry decisions with extreme caution. Ahead of major fundamental reports, it is best to stay out of the market to avoid sharp price fluctuations. If you decide to trade during news releases, always place stop-loss orders to minimize losses. Without stop-loss orders, you can very quickly lose your entire deposit, especially if you do not use proper money management and trade large volumes.
And remember that successful trading requires a clear trading plan, such as the one presented above. Spontaneous trading decisions based on the current market situation are an inherently losing strategy for an intraday trader.


