
Vea también


 28.09.2026 05:06 AM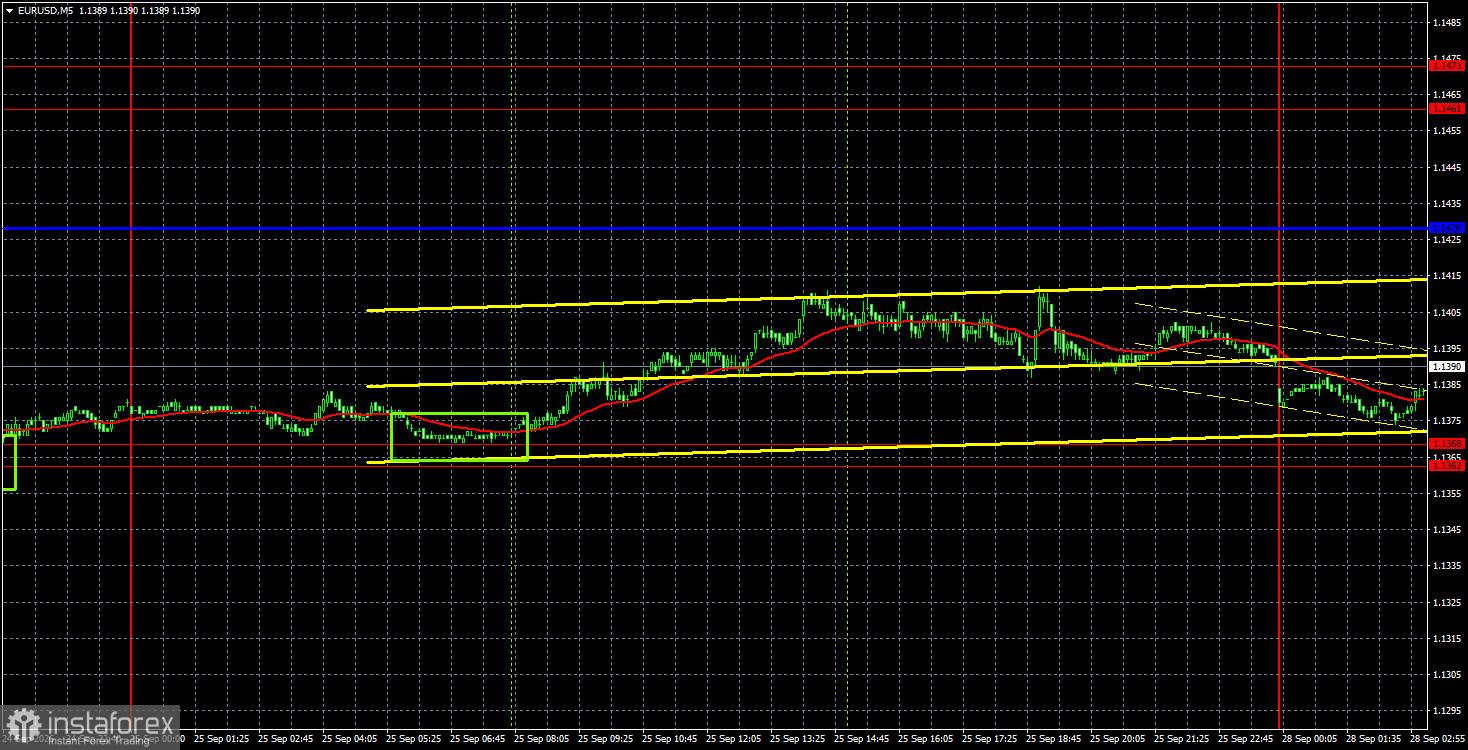
The EUR/USD pair corrected slightly on Friday but failed to overcome the 1.1362–1.1368 area. Therefore, traders can expect some correction this week. A stronger rise in the euro is only possible after the descending trend line is breached. The European currency remains extremely weak, though this is not its fault. The market continues to buy the dollar en masse based on a hawkish shift in Federal Reserve views, even though that factor should have been priced in long ago. The market began pricing Fed rate increases back in the summer when Kevin Warsh spoke about high inflation. By contrast, the market shows no interest in European Central Bank tightening. So we cannot call the current movement logical. Nevertheless, it exists and must be traded. Since fundamental and macro factors are largely ignored, we will have to rely more on technicals. This week, the US will publish key PCE and ISM indices, as well as jobs reports and NFP. These releases can influence market sentiment, but in any case, bearish bias will likely remain until bears become exhausted.
Technically, the downward trend continues to form. The market keeps pricing in future Fed rate hikes, which already looks absurd. The trend line remains relevant, and price sits below the Ichimoku lines, so technically the pair's decline is entirely consistent — but only on the hourly timeframe. The weekly timeframe still shows an uptrend.
On the 5-minute timeframe, one buy signal was formed on Friday that could have yielded about 20–30 pips. During the European session, price bounced from the 1.1362–1.1368 area, allowing long positions to be opened.
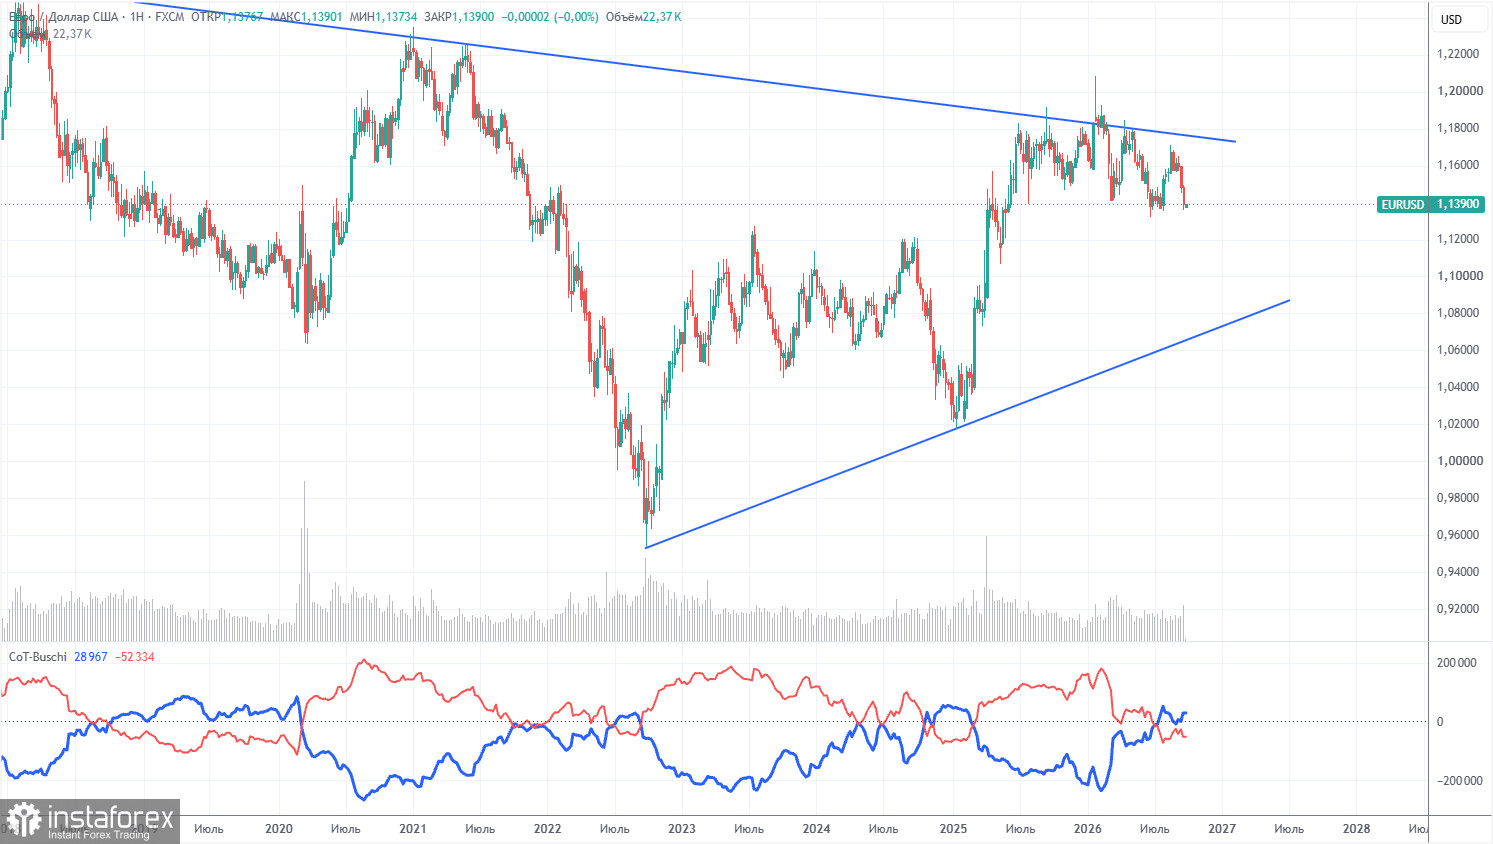
The latest COT report is dated September 22. On the weekly timeframe, non-commercial traders' net position remains clearly bearish and has significantly decreased in 2026 because of geopolitical events. Traders have been disposing of the euro in favor of the US dollar over the past six months. Donald Trump's policies have not changed, but the dollar served as a reserve currency for a time.
However, we still do not see any fundamental factors for further US dollar strengthening. The war in the Middle East made the dollar super-attractive for a while, and the Fed's monetary stance surprised the dollar a second time this year. In the long term, the euro could fall even to $1.08 (trend line), but the uptrend will remain relevant. Over recent months of dollar appreciation, the pair has not come close to that trend line.
The positions of the red and blue indicator lines indicate approximate parity between bulls and bears. During the last reporting week, the number of long positions in the "Non-commercial" group rose by 11,700, while shorts increased by 37,000. Accordingly, the net position fell by 25,300 contracts over the week.
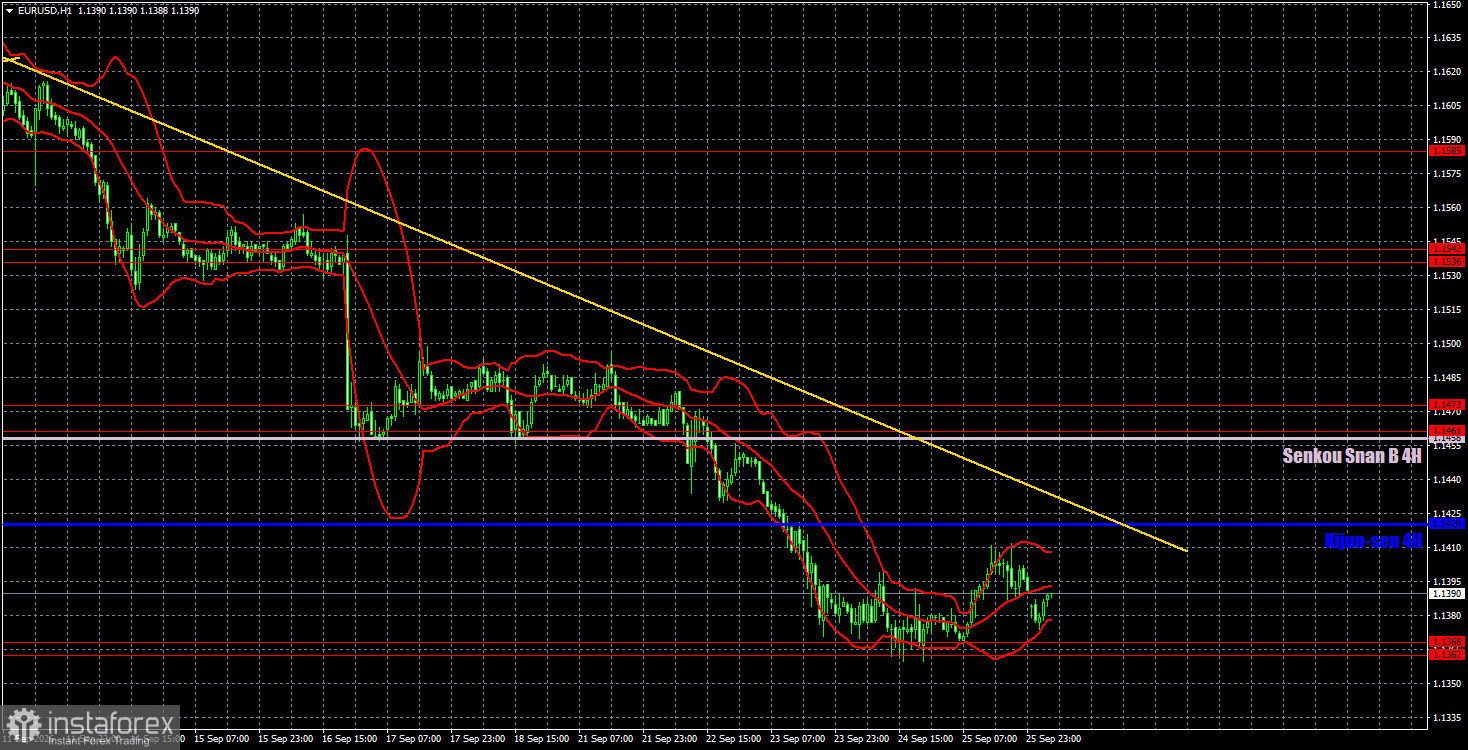
On the hourly timeframe, EUR/USD continues to form a downward trend, and the Fed has strongly contributed to the southbound move. The ECB should have supported the euro by raising rates for the second time in 2026, but the market now sees only the Fed and its tightening. Thus, the dollar has effectively formed an entire trend out of nowhere, and market sentiment may remain "bearish."
For September 28 we highlight the following levels for trading — 1.1234, 1.1274, 1.1362–1.1368, 1.1461–1.1473, 1.1536–1.1542, 1.1585, 1.1657–1.1665, 1.1750–1.1760, as well as the Senkou Span B line (1.1458) and the Kijun-sen (1.1420). The Ichimoku indicator lines may shift during the day, which should be taken into account when determining trading signals. Don't forget to move the Stop Loss to breakeven if the price moves 15 pips in the correct direction. This will protect against possible losses if the signal proves false.
On Monday, no important events or releases are scheduled in the EU or the US, so intraday market moves are likely to be weak. Traders will need to rely on technical factors when making trading decisions today, and intraday volatility may be low.
If price consolidates below the 1.1362–1.1368 area, traders can consider short targets near 1.1274. If price rebounds again from the 1.1362–1.1368 area, consider bullish targets at 1.1420 and 1.1458.
Support and resistance price levels are thick red lines where movement may conclude. They are not sources of trading signals.
The Kijun-sen and Senkou Span B lines are Ichimoku indicator lines transferred to the hourly timeframe from the 4-hour timeframe. They are strong lines.
Extreme levels are thin red lines from which the price has previously rebounded. They are sources of trading signals.
Yellow lines indicate trend lines, trending channels, and any other technical patterns.
Indicator 1 on COT charts shows the size of the net position of each category of traders.


