
Vea también


 17.11.2026 05:30 AM
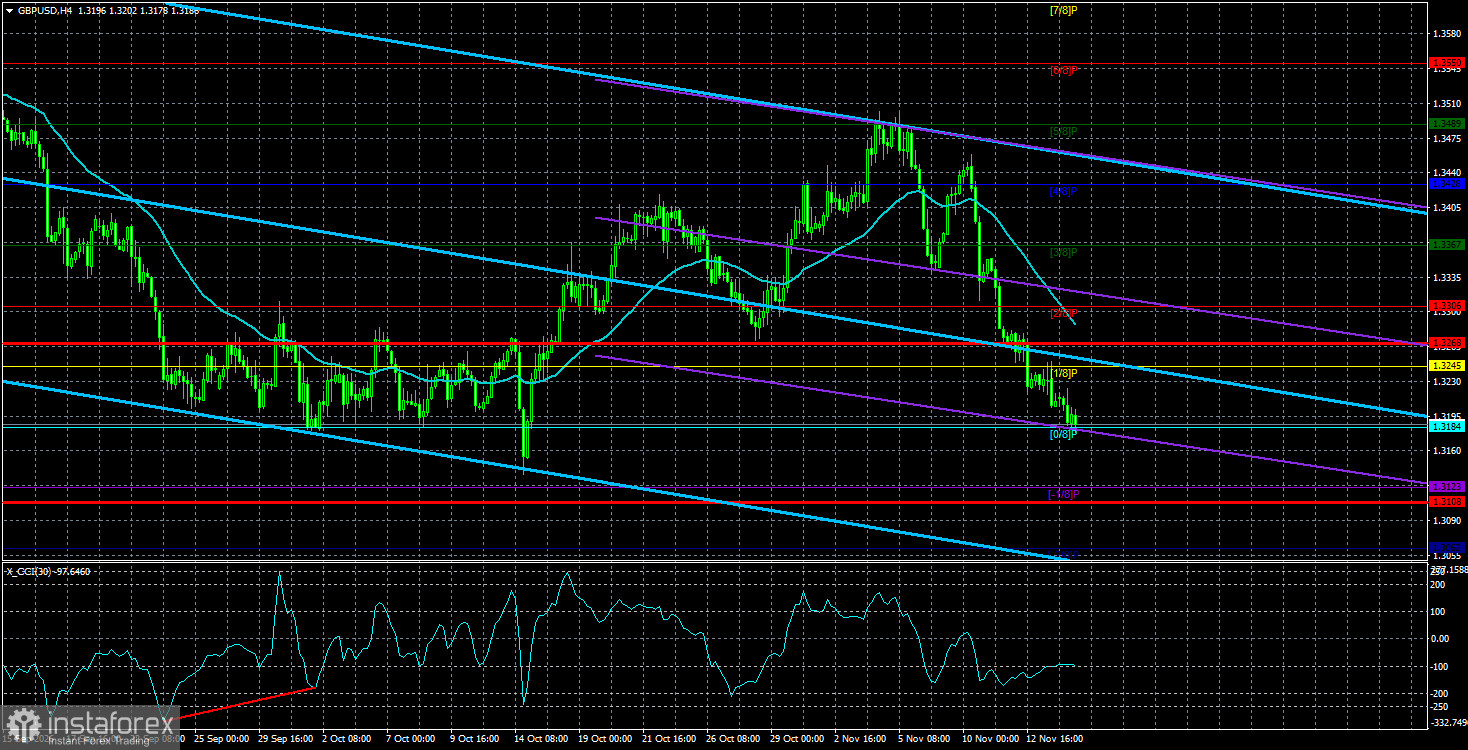
The GBP/USD currency pair continued its downward move throughout Monday, also without hesitation. Market "hawkish" expectations regarding Federal Reserve policy are rising, so the dollar's rise seems logical. It does not matter that the Bank of England is also tightening policy, nor that the British economy has not seen any sharp downturns recently. Moreover, UK GDP showed fairly strong growth in Q3, and inflation continues to rise, likewise increasing the likelihood of a longer and stronger policy tightening, similar to the Fed's case.
But no one cares. The pound has been falling for one and a half full weeks and is currently near the lower bounds of two sideways channels on the weekly and daily charts. We still believe that the 1.3150–1.3180 area will determine the pound's further fate. It is important to understand what may occur in that area. First, a deviation could form, which on the charts would look like a breakout of all recent lows followed by a sharp move up. Second, a normal rebound from the area could form with a similar move up. That is, one should not assume the price will simply smoothly reverse within the designated area and that everyone will immediately open long positions. Most likely the technical picture will be much more complex and interesting.
By the way, if the euro's fall on Monday can still be explained by a weaker-than-expected industrial production report, on what basis did the pound fall? Ah yes... "Strengthening hawkish expectations and sentiment." After all, that is the only factor that affects FX pricing these days.
The pound, in general, trades much more technically than the euro. We do not see any drivers for dollar strength in 2026 other than geopolitics. Throughout 2026, the pound has traded flat between 1.3180 and 1.3650. Thus, almost all moves of the pound can be easily explained. A flat is always random—inside the sideways channel, moves can occur that aren't tied to fundamentals or macro reports. That is exactly what we have observed this year.
If the pound remains inside the sideways channel, it could again head from the lower boundary toward 1.3650. And the long-term uptrend remains relevant... As for Kevin Warsh's speech on Monday, did anyone really expect the Fed chair to start announcing policy tightening next year? Everyone knows US inflation continues to rise. Everyone knows the Fed will continue raising the policy rate. Warsh seeks to limit public contacts and keep the central bank's future steps secret. The market has been interpreting all his recent remarks as it pleases. As before, we expect an upward price reversal and a strong rise in the pound. If price leaves the sideways channel, we will change the strategy.
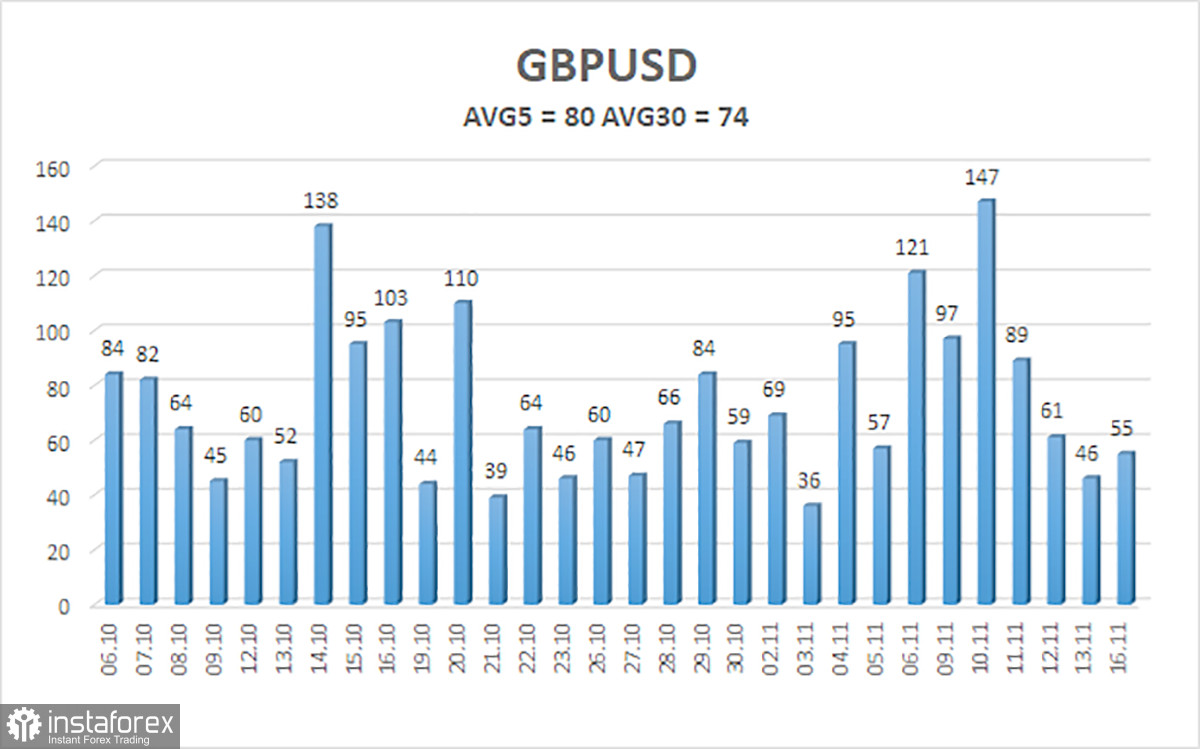
The average volatility of the GBP/USD pair over the last 5 trading days is 80 pips. For the pound/dollar pair this value is "average." On Tuesday, November 17, we therefore expect movement within the range bounded by the levels 1.3108 and 1.3268. The higher linear regression channel is directed downward, indicating a downtrend. The CCI indicator has recently not entered overbought/oversold areas and has not formed divergences.
S1 – 1.3184;
S2 – 1.3123;
S3 – 1.3062
R1 – 1.3245;
R2 – 1.3306;
R3 – 1.3367
The GBP/USD currency pair has entered a new downward trend within a sideways channel on the daily TF. 2026 has been extremely positive for the dollar due to geopolitics and inflation, which forced capital to seek safety and pushed the Fed to return to tightening monetary policy. However, on the weekly TF, price remains flat between 1.3150 and 1.3780 within a four-year uptrend, supporting expectations of pound appreciation in the medium term. Long positions with targets of 1.3428 and 1.3489 can be considered when the price is above the moving average. When price is below the moving average, trading to the downside is possible, with targets of 1.3184 and 1.3150–1.3180. Be careful with short positions—the price is again approaching the lower bounds of the sideways channels.


