Triple Bottom
was formed on 26.03 at 08:15:30 (UTC+0)
signal strength 2 of 5
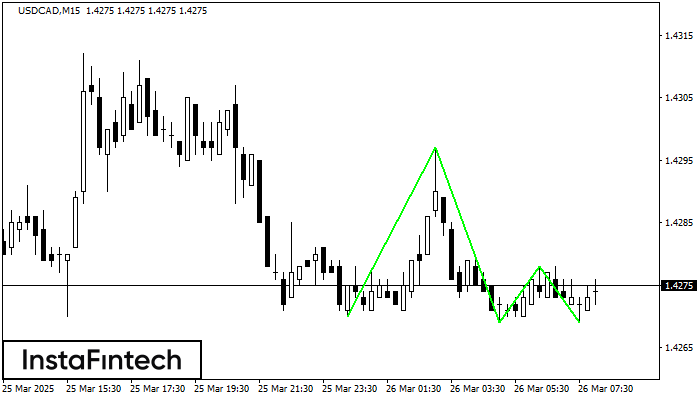
The Triple Bottom pattern has formed on the chart of the USDCAD M15 trading instrument. The pattern signals a change in the trend from downwards to upwards in the case of breakdown of 1.4297/1.4278.
The M5 and M15 time frames may have more false entry points.
- All
- All
- Bearish Rectangle
- Bearish Symmetrical Triangle
- Bullish Rectangle
- Double Top
- Double Top
- Triple Bottom
- Triple Bottom
- Triple Top
- Triple Top
- All
- All
- Buy
- Sale
- All
- 1
- 2
- 3
- 4
- 5
Doble Piso
was formed on 08.06 at 10:06:13 (UTC+0)
signal strength 1 of 5
El patrón Doble Piso ha sido formado en #Bitcoin M5. Características: el nivel de soporte 105358.42; el nivel de resistencia 105551.46; el ancho del patrón 19304 puntos. Si el nivel
Los marcos de tiempo M5 y M15 pueden tener más puntos de entrada falsos.
Open chart in a new window
Doble Piso
was formed on 08.06 at 05:35:30 (UTC+0)
signal strength 1 of 5
El patrón Doble Piso ha sido formado en #Bitcoin M5. Características: el nivel de soporte 105347.39; el nivel de resistencia 105744.30; el ancho del patrón 39691 puntos. Si el nivel
Los marcos de tiempo M5 y M15 pueden tener más puntos de entrada falsos.
Open chart in a new window
Triple Techo
was formed on 08.06 at 01:30:12 (UTC+0)
signal strength 2 of 5
El patrón Triple Techo ha sido formado en el gráfico de #Bitcoin M15. Características del patrón: los límites tienen un ángulo ascendente, la línea inferior del patrón tiene coordenadas 105222.82/105606.00
Los marcos de tiempo M5 y M15 pueden tener más puntos de entrada falsos.
Open chart in a new window