Bullish Symmetrical Triangle
was formed on 15.04 at 22:01:32 (UTC+0)
signal strength 3 of 5
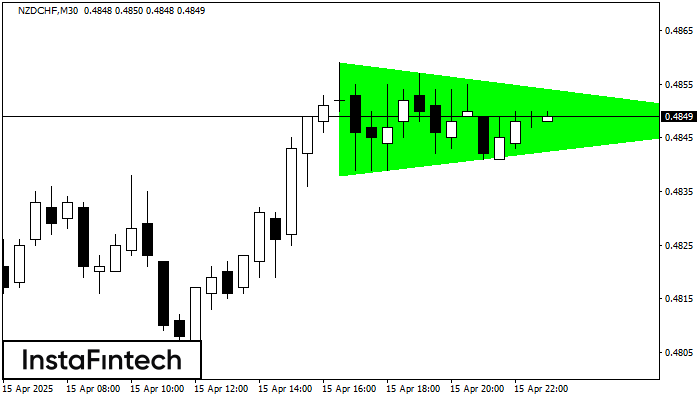
According to the chart of M30, NZDCHF formed the Bullish Symmetrical Triangle pattern. The lower border of the pattern touches the coordinates 0.4838/0.4848 whereas the upper border goes across 0.4859/0.4848. If the Bullish Symmetrical Triangle pattern is in progress, this evidently signals a further upward trend. In other words, in case the scenario comes true, the price of NZDCHF will breach the upper border to head for 0.4878.
Vea asimismo
- All
- All
- Bearish Rectangle
- Bearish Symmetrical Triangle
- Bullish Rectangle
- Double Top
- Double Top
- Triple Bottom
- Triple Bottom
- Triple Top
- Triple Top
- All
- All
- Buy
- Sale
- All
- 1
- 2
- 3
- 4
- 5
Doble Techo
was formed on 06.06 at 05:05:28 (UTC+0)
signal strength 1 of 5
El patrón de reversión Doble Techo ha sido formado en GBPJPY M5. Características: el límite superior 195.21; el límite inferior 194.97; el ancho del patrón es 24 puntos. Es mejor
Los marcos de tiempo M5 y M15 pueden tener más puntos de entrada falsos.
Open chart in a new window
Cabeza y Hombros
was formed on 06.06 at 05:01:27 (UTC+0)
signal strength 4 of 5
El patrón técnico llamado Cabeza y Hombros ha aparecido en el gráfico de NZDCAD H1. Existen razones poderosas para sugerir que el precio superará la línea de cuello 0.8239/0.8244 después
Open chart in a new window
Cabeza y Hombros Inverso
was formed on 06.06 at 05:00:19 (UTC+0)
signal strength 4 of 5
Según H1, EURNZD está formando el patrón técnico: el Cabeza y Hombros Inverso. En caso de que la línea de cuello 1.8948/1.8962 se rompa, es posible que el instrumento
Open chart in a new window