Bullish Rectangle
was formed on 01.05 at 18:33:45 (UTC+0)
signal strength 1 of 5
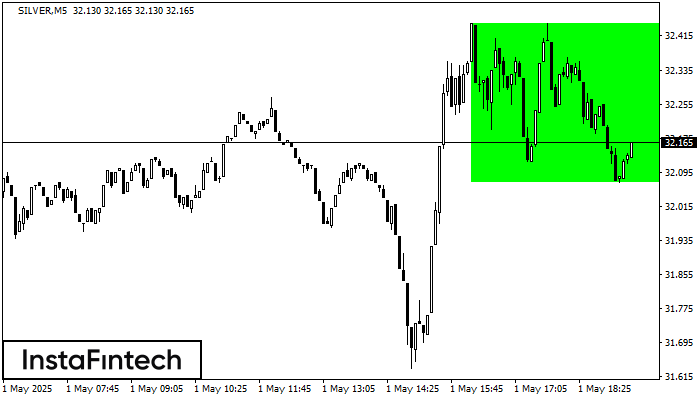
According to the chart of M5, SILVER formed the Bullish Rectangle. The pattern indicates a trend continuation. The upper border is 32.45, the lower border is 32.07. The signal means that a long position should be opened above the upper border 32.45 of the Bullish Rectangle.
The M5 and M15 time frames may have more false entry points.
Vea asimismo
- All
- All
- Bearish Rectangle
- Bearish Symmetrical Triangle
- Bullish Rectangle
- Double Top
- Double Top
- Triple Bottom
- Triple Bottom
- Triple Top
- Triple Top
- All
- All
- Buy
- Sale
- All
- 1
- 2
- 3
- 4
- 5
Doble Techo
was formed on 07.06 at 11:00:16 (UTC+0)
signal strength 3 of 5
El patrón de reversión Doble Techo ha sido formado en #Bitcoin M30. Características: el límite superior 105283.16; el límite inferior 103816.55; el ancho del patrón es 147353 puntos. Es mejor
Open chart in a new window
Doble Techo
was formed on 06.06 at 22:30:10 (UTC+0)
signal strength 2 of 5
En el gráfico de USDCAD M15 el patrón de reversión Doble Techo ha sido formado. Características: límite superior 1.3702; límite inferior 1.3668; el ancho del patrón 34 puntos. La señal
Los marcos de tiempo M5 y M15 pueden tener más puntos de entrada falsos.
Open chart in a new window
Triángulo Simétrico Alcista
was formed on 06.06 at 22:18:11 (UTC+0)
signal strength 2 of 5
Según el gráfico de M15, el AUDJPY formó el patrón Triángulo Simétrico Alcista. El límite inferior del patrón toca las coordenadas 93.96/94.02 donde el límite superior cruza 94.07/94.02
Los marcos de tiempo M5 y M15 pueden tener más puntos de entrada falsos.
Open chart in a new window