Bearish Symmetrical Triangle
was formed on 04.06 at 04:16:58 (UTC+0)
signal strength 2 of 5
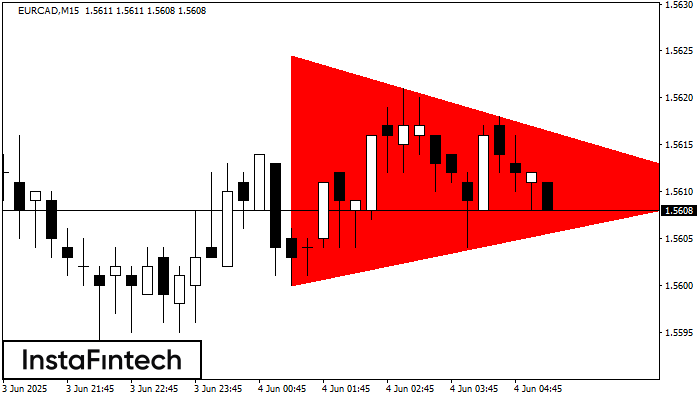
According to the chart of M15, EURCAD formed the Bearish Symmetrical Triangle pattern. This pattern signals a further downward trend in case the lower border 1.5600 is breached. Here, a hypothetical profit will equal the width of the available pattern that is -25 pips.
The M5 and M15 time frames may have more false entry points.
Vea asimismo
- All
- All
- Bearish Rectangle
- Bearish Symmetrical Triangle
- Bullish Rectangle
- Double Top
- Double Top
- Triple Bottom
- Triple Bottom
- Triple Top
- Triple Top
- All
- All
- Buy
- Sale
- All
- 1
- 2
- 3
- 4
- 5
Rectángulo Bajista
was formed on 09.07 at 18:50:04 (UTC+0)
signal strength 1 of 5
Según el gráfico de M5, #PEP formó el Rectángulo Bajista. Este tipo de patrón indica la continuación de una tendencia. Esto consiste de dos niveles: resistencia 133.83 - 0.00
Los marcos de tiempo M5 y M15 pueden tener más puntos de entrada falsos.
Open chart in a new window
Rectángulo Bajista
was formed on 09.07 at 18:50:02 (UTC+0)
signal strength 1 of 5
Según el gráfico de M5, #PEP formó el Rectángulo Bajista. El patrón indica la continuación de una tendencia. El límite superior es 133.83, el límite inferior es 132.94. La señal
Los marcos de tiempo M5 y M15 pueden tener más puntos de entrada falsos.
Open chart in a new window
Triple Piso
was formed on 09.07 at 18:20:21 (UTC+0)
signal strength 1 of 5
El patrón Triple Piso ha sido formado en el gráfico de #TSLA M5. Características del patrón: línea inferior del patrón tiene coordenadas 299.81 con el límite superior 299.81/296.14, la proyección
Los marcos de tiempo M5 y M15 pueden tener más puntos de entrada falsos.
Open chart in a new window