


Los patrones son modelos gráficos que se forman en el gráfico mediante el precio. Según uno de los postulados del análisis técnico, la historia (movimiento del precio) se repite. Esto quiere decir que los movimientos del precio a menudo son similares en las mismas situaciones que hacen posible pronosticar el futuro desarrollo de la situación con una alta probabilidad.
Los patrones relevantes de InstaTrade son un servicio fácil de utilizar que permiten que conozca los últimos cambios en el mercado y reaccione a las pistas del mercado a tiempo. En nuestro servicio, siempre encontrará los últimos y más importantes patrones en cualquier par y en cualquier marco de tiempo.
Head and Shoulders
was formed on 09.06 at 15:40:28 (UTC+0)
signal strength 1 of 5
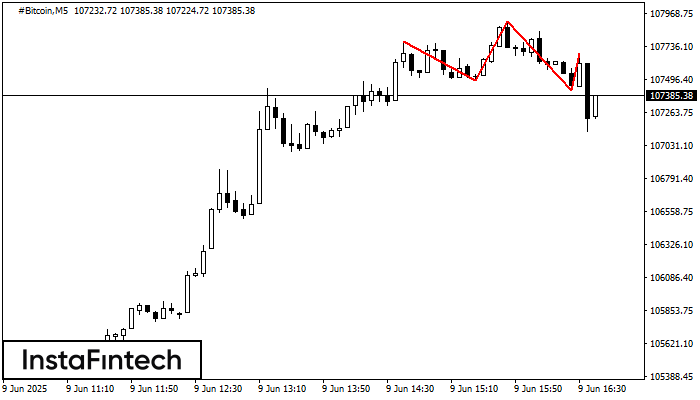
The #Bitcoin M5 formed the Head and Shoulders pattern with the following features: The Head’s top is at 107912.77, the Neckline and the upward angle are at 107491.49/107422.45. The formation of this pattern can bring about changes in the current trend from bullish to bearish. In case the pattern triggers the expected changes, the price of #Bitcoin will go towards 107422.30.
The M5 and M15 time frames may have more false entry points.


