Bullish Rectangle
was formed on 10.06 at 20:56:52 (UTC+0)
signal strength 1 of 5
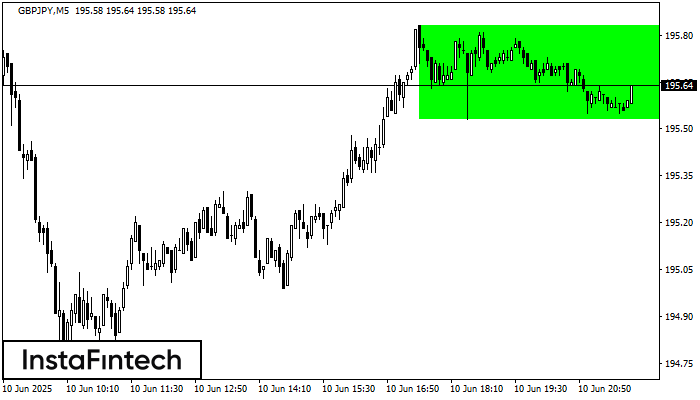
According to the chart of M5, GBPJPY formed the Bullish Rectangle. The pattern indicates a trend continuation. The upper border is 195.83, the lower border is 195.53. The signal means that a long position should be opened above the upper border 195.83 of the Bullish Rectangle.
The M5 and M15 time frames may have more false entry points.
Vea asimismo
- All
- All
- Bearish Rectangle
- Bearish Symmetrical Triangle
- Bullish Rectangle
- Double Top
- Double Top
- Triple Bottom
- Triple Bottom
- Triple Top
- Triple Top
- All
- All
- Buy
- Sale
- All
- 1
- 2
- 3
- 4
- 5
Cabeza y Hombros
was formed on 14.08 at 07:45:57 (UTC+0)
signal strength 2 of 5
El NZDUSD M15 formó el patrón Cabeza y Hombros con las siguientes características: El techo de la Cabeza se encuentra en 0.5987, la línea de cuello y el ángulo alcista
Los marcos de tiempo M5 y M15 pueden tener más puntos de entrada falsos.
Open chart in a new window
Cabeza y Hombros
was formed on 14.08 at 07:30:27 (UTC+0)
signal strength 2 of 5
Según el gráfico de M15, GBPUSD formó el patrón. El techo de la Cabeza está establecido en 1.3590 mientras la línea media del Cuello se encuentra en 1.3569/1.3569. La formación
Los marcos de tiempo M5 y M15 pueden tener más puntos de entrada falsos.
Open chart in a new window
Cabeza y Hombros
was formed on 14.08 at 07:30:17 (UTC+0)
signal strength 3 of 5
Según el gráfico de M30, GBPUSD formó el patrón. El techo de la Cabeza está establecido en 1.3590 mientras la línea media del Cuello se encuentra en 1.3562/1.3569. La formación
Open chart in a new window