


Los patrones son modelos gráficos que se forman en el gráfico mediante el precio. Según uno de los postulados del análisis técnico, la historia (movimiento del precio) se repite. Esto quiere decir que los movimientos del precio a menudo son similares en las mismas situaciones que hacen posible pronosticar el futuro desarrollo de la situación con una alta probabilidad.
Los patrones relevantes de InstaTrade son un servicio fácil de utilizar que permiten que conozca los últimos cambios en el mercado y reaccione a las pistas del mercado a tiempo. En nuestro servicio, siempre encontrará los últimos y más importantes patrones en cualquier par y en cualquier marco de tiempo.
Double Top
was formed on 24.06 at 08:30:04 (UTC+0)
signal strength 3 of 5
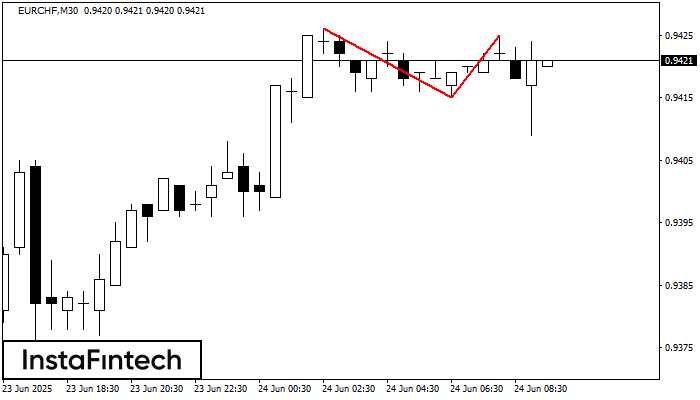
The Double Top reversal pattern has been formed on EURCHF M30. Characteristics: the upper boundary 0.9426; the lower boundary 0.9415; the width of the pattern is 10 points. Sell trades are better to be opened below the lower boundary 0.9415 with a possible movements towards the 0.9385 level.


