See also

 24.03.2023 05:54 PM
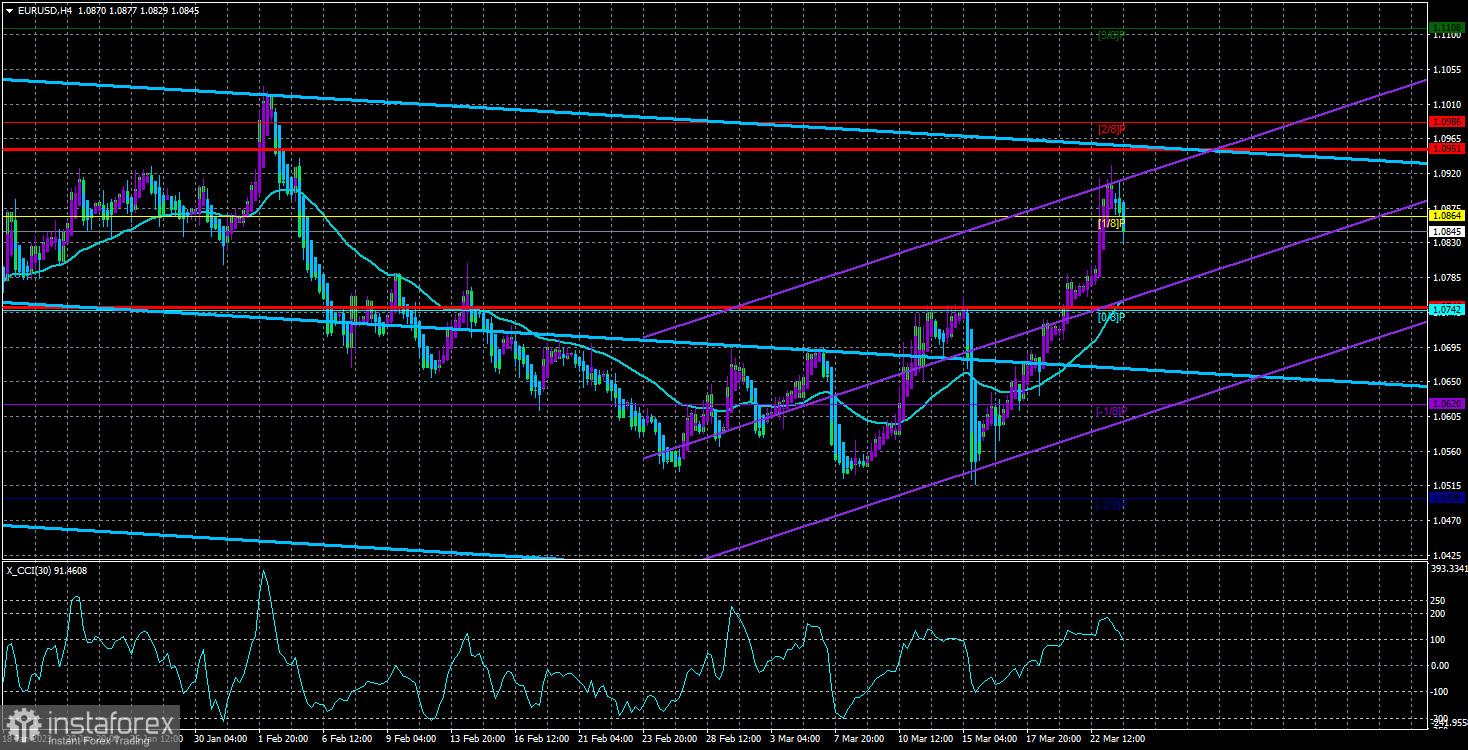
The ECB began raising interest rates six months later than the Fed, causing the euro to decline sharply. The scenario changed to the contrary in the second half of 2023. In America, rumors of a slowing in the rate of monetary policy tightening and a decrease in inflation started to emerge. The world's reserve currency and the strongest economy in the world are still slowing down, but the rate is consistently rising as prices continue to increase at a reasonably rapid rate.
Therefore, the Fed's concern over high inflation and willingness to hike the rate as high as feasible solely to relieve pricing pressure is not surprising. If the growth of the euro/dollar pair in the second half of the year was rather predictable (albeit, in our opinion, excessively strong), then the growth of the euro currency in the last two weeks is already surprising. We alerted traders a few months ago to the fact that there aren't many local reasons supporting the euro. Yes, the Fed started to slow down rate increases, and there was discussion of the potential rejection of tightening monetary policy. However, the rate is still rising and has been doing so for some time. As a result, both rates are growing, but the US dollar no longer has an advantage.
The emergency QE program implemented by the Fed following the simultaneous failure of three large banks in the United States may be one of the causes of what is currently occurring. This program has a budget of roughly $300 billion, which will be printed and given to the Ministry of Finance for use in both returning money to bank depositors and stabilizing the financial sector. We are not very concerned about the use of this money, though. The fact that they will be printed and put into the economy is of significance to us. At the same time, the Fed continues to pursue the QT program, which entails lowering the money supply and is used to tighten monetary policy. It turns out that the dollar has been struggling for the past six months as a whole, but recent news has made things considerably worse.
From our perspective, the recent decline in the value of the US dollar is nonsensical. Yes, printing 300 billion dollars is a significant amount that will once again come out of thin air, but the Fed also created several trillion dollars in 2020 and 2021, more than doubling the amount of money in circulation. Why does the American dollar suddenly decline when it reaches the "pathetic" 300 billion when it did not pay attention to this moment at the time? Neither the ECB nor the Fed is involved. The rate is increasing, but we are only referring to the recent hikes that were reported. The rate may only rise by 0.25 percent in May, and it is unclear how much further the ECB can raise the rate. After all, unlike the United States, Europe cannot ignore economic growth. The EU economy has been extremely close to entering a recession for some time. The likelihood of a severe recession increases as the pace of growth rises. Inflation in the European Union may begin to rise again, as it has in France and Germany, as well as many other EU members. As a result, the ECB rate must be increased even further, a move that the Central Bank might not be prepared to make.
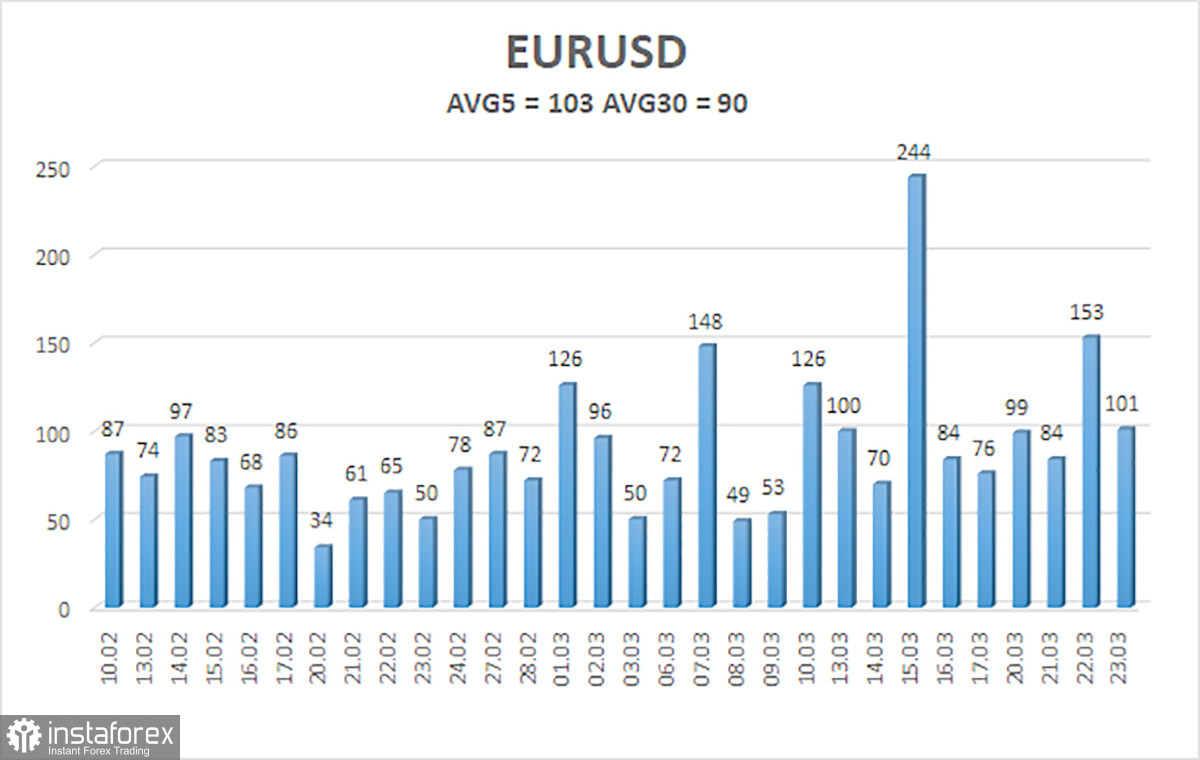
As of March 24, the euro/dollar currency pair's average volatility over the previous five trading days was 103 points, which is considered "high." As a result, we anticipate that the pair will move on Friday between 1.0746 and 1.0951. The Heiken Ashi indicator will turn back up to signal the start of the upward movement.
Nearest levels of support
S1 – 1.0742
S2 – 1.0620
S3 – 1.0498
Nearest levels of resistance
R1 – 1.0864
R2 – 1.0986
R3 – 1.1108
Trading Suggestions:
A round of downward correction has begun for the EUR/USD pair. Currently, we can take into account opening additional long positions with targets of 1.0951 and 1.0986 if the Heiken Ashi indicator reverses its trend upward. After the price is fixed below the moving average line, short positions can be opened with a target of 1.0620.
Explanations for the illustrations:
Determine the present trend with the use of linear regression channels. The trend is now strong if they are both moving in the same direction.
Moving average line (settings 20.0, smoothed): This indicator identifies the current short-term trend and the trading direction.
Murray levels serve as the starting point for adjustments and movements.
Based on current volatility indicators, volatility levels (red lines) represent the expected price channel in which the pair will trade the following day.
A trend reversal in the opposite direction is imminent when the CCI indicator crosses into the overbought (above +250) or oversold (below -250) zones.


