See also

 29.05.2025 07:56 PM
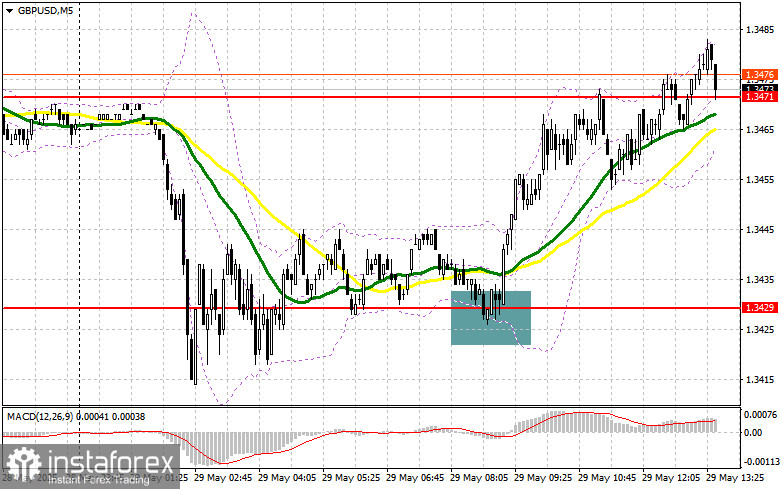
In my morning forecast, I focused on the 1.3429 level and planned to base market entry decisions on it. Let's look at the 5-minute chart and analyze what happened. A decline followed by a false breakout at this level provided a buy entry point for the pound, resulting in a rise toward the target level of 1.3471. The technical picture was revised for the second half of the day.
To Open Long Positions on GBP/USD:
The pound has regained all losses, helped by the lack of important UK data. The focus now shifts to U.S. GDP figures, initial jobless claims, and FOMC member speeches. Only exceptionally strong data — which is unlikely — could bring renewed pressure on the pair.
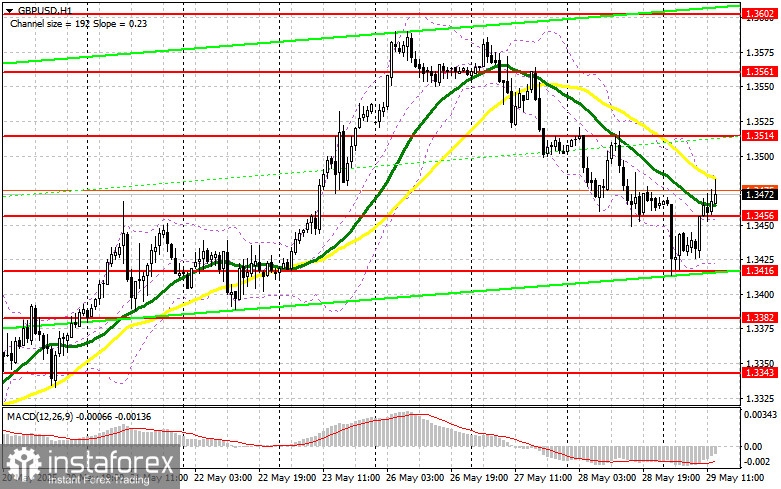
In case of a decline, I prefer to act around the new support level at 1.3456, formed earlier today. A false breakout at this level will provide a good entry point for long positions, targeting resistance at 1.3514. A breakout and retest of this range from above will form a new long entry setup with the potential to update 1.3561, restoring the bullish trend. The final target will be the 1.3602 area, where I plan to take profit.
If GBP/USD falls and there's no bullish activity at 1.3456, pressure on the pound could return. In this case, only a false breakout around 1.3416 would justify opening long positions. Alternatively, I plan to buy on a rebound from the 1.3382 support level, aiming for a 30–35 point intraday correction.
To Open Short Positions on GBP/USD:
Sellers have not shown themselves yet, likely waiting for strong U.S. GDP data. If GBP/USD rises again, I will only act after a false breakout around the 1.3574 resistance area, just below which moving averages are positioned in favor of the bears. This would be enough to justify a short entry, aiming for a drop toward 1.3456. A breakout and retest of that range from below will trigger stop-loss orders and open the path toward 1.3416. The final target will be the 1.3382 zone, where I plan to lock in profits.
If demand for the pound continues later today and bears remain inactive at 1.3514, it would be better to delay selling until the 1.3561 resistance is tested. I will open short positions there only after a false breakout. If there's no downward reaction even there, I'll consider shorting around 1.3602, but only for a 30–35 point intraday correction.
COT Report (Commitments of Traders) – May 20:
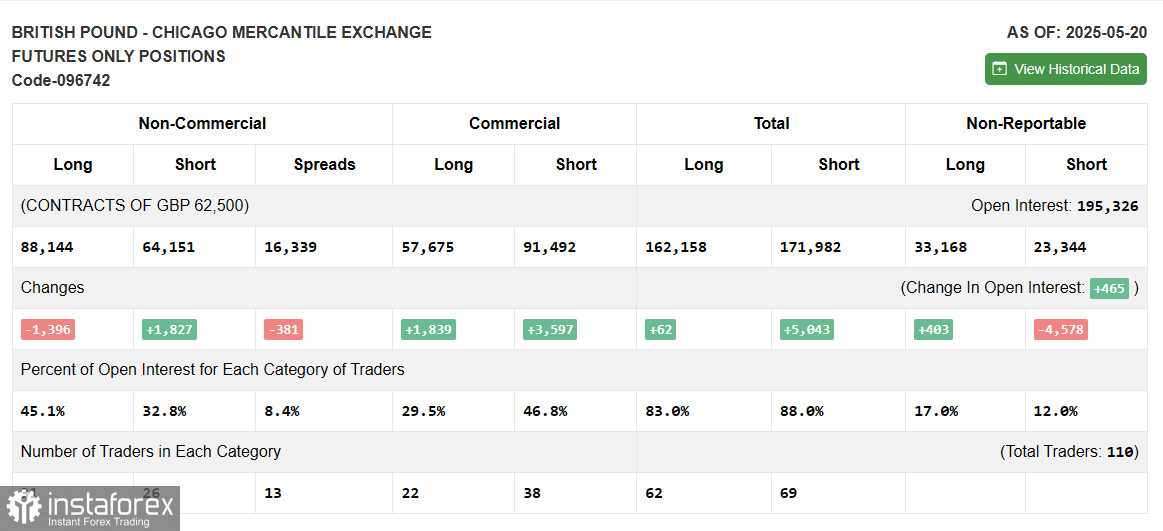
The COT report showed a reduction in long positions and an increase in shorts. Despite the Bank of England's plans to lower interest rates, demand for the pound remains solid following the UK–U.S. trade agreement. The Federal Reserve's similar rate-cut outlook weakens the dollar, allowing the pound to continue rising.
Currently, there's no significant UK data ahead, so major players are more likely to buy than sell. The latest COT report showed long non-commercial positions down by 1,396 to 88,144, while short positions rose by 1,827 to 64,151. As a result, the net long-short gap narrowed by 381.
Indicator Signals:
Moving Averages: Trading is occurring below the 30- and 50-period MAs, suggesting possible downward pressure for the pound.Note: Periods and prices refer to the H1 chart and differ from classical D1 moving averages.
Bollinger Bands: In case of a decline, the lower band near 1.3416 will act as support.
Indicator Descriptions:


