
See also


 18.08.2026 08:34 AM
Bitcoin and Ethereum are still going through a correction, which could take quite a long time. Over the past month and a half, Ethereum and Bitcoin have managed a modest recovery, but there are still no signs that the downtrend that began last year has ended. The fundamental backdrop remains weak for the crypto market, primarily expressed in low spot demand, capital flowing into the artificial intelligence sector, and the Fed's commitment to bringing inflation to 2%, which implies at least a prolonged tight monetary policy. Thus, we still see no reason for a sustained rally in Bitcoin and Ethereum.
Meanwhile, CryptoQuant experts have urged retail traders not to attempt to "catch" the market bottom. They reported that the share of Bitcoin supply in profit has fallen to 51%, the lowest level in three years and historically an indicator that precedes an accumulation phase. In other words, Bitcoin is already trading at levels where new bull trends have historically begun. However, it's not that simple. We have often said that historical data is useful, but it's na?ve to assume every new Bitcoin cycle will follow the old rules. In our view, nothing prevents Bitcoin from a further fall in the medium term and dropping well below $50,000. It should be understood that the proportion of underwater Bitcoin positions can be anything. If investors are unwilling to buy "digital gold" now, and supply on exchanges exceeds demand, then regardless of what any indicators say, there will be no upward move.
CryptoQuant experts also noted that the "market bottom" is a very elastic concept. Its formation can take a very long time. Many market participants may lack the patience because of fear of further declines. Thus, to "catch the bottom", one needs not only conviction but also patience. We would add that we do not consider current levels of the "digital gold" to be the market bottom, and therefore we expect further declines in the leading cryptocurrency.
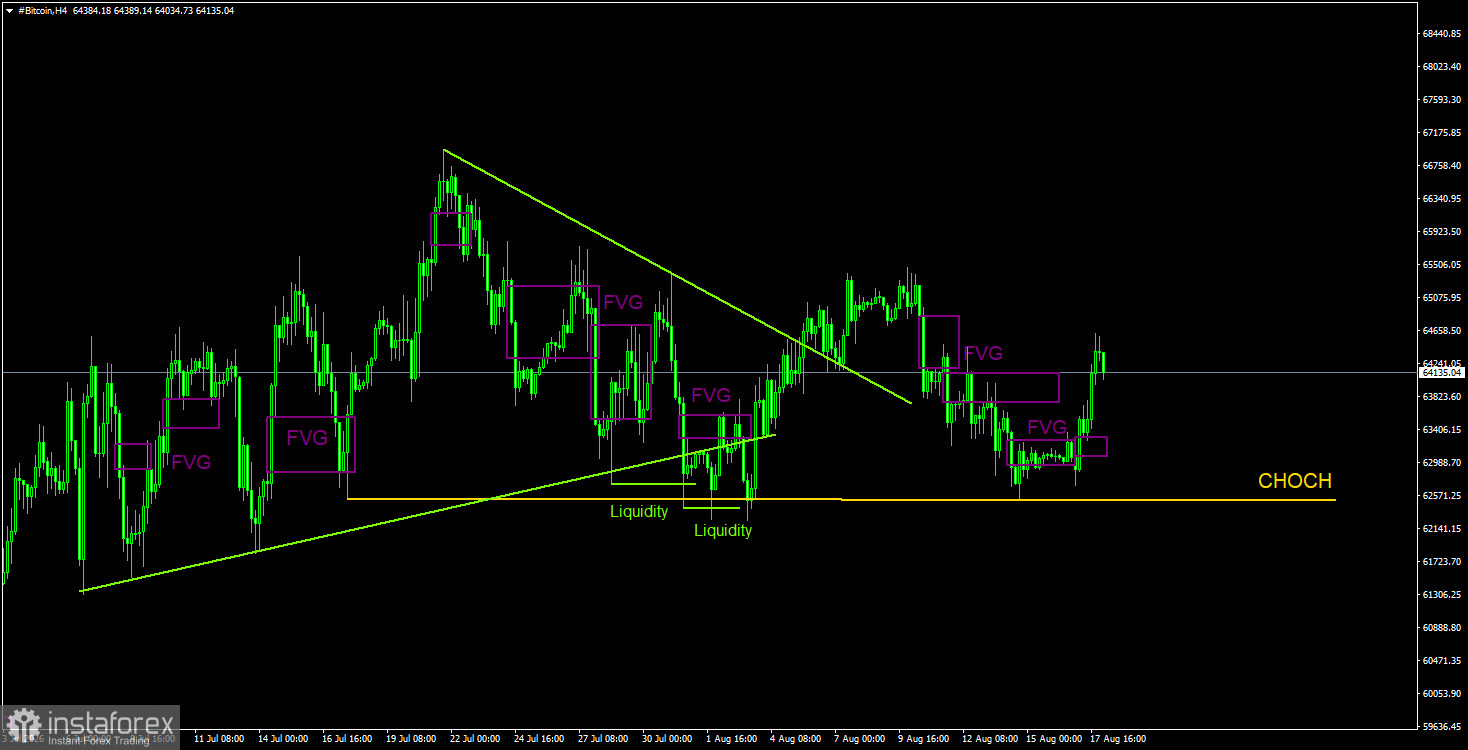
Bitcoin continues to form a full-fledged downtrend. We continue to expect a decline targeting $57,500 (the 61.8% Fibonacci level of the three-year uptrend), although this level has essentially already been worked off. We do not believe the downtrend is over. The last bearish FVG pattern was formed in the $68,000–70,700 area on the daily timeframe, so that zone serves as a POI for short positions in the coming weeks. On the 4-hour timeframe, Bitcoin is again biased toward a fall, but movements will most likely remain choppy and swing-like. Traders can consider trades from local patterns, but we would not count on strong moves right now.
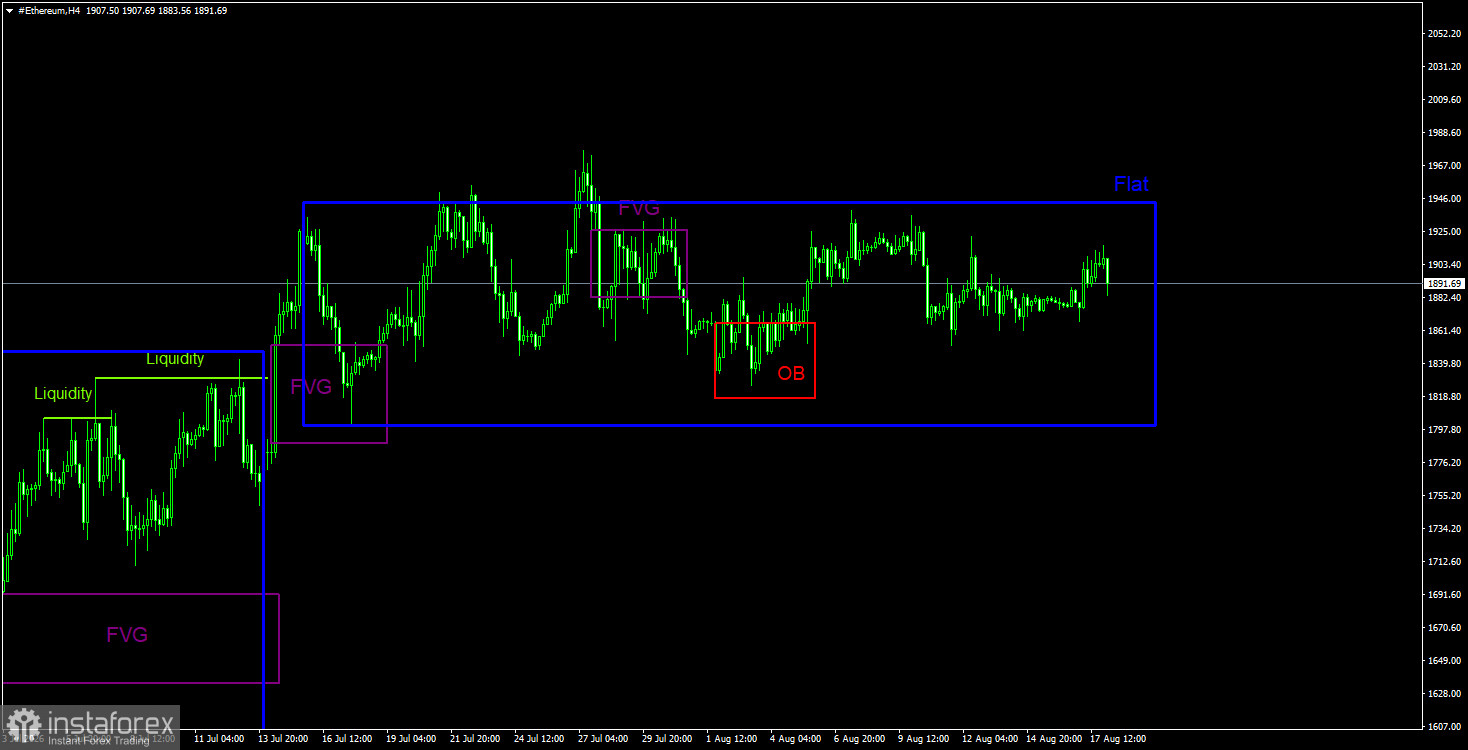
On the daily timeframe, the downtrend that began in August last year continues. The key sell pattern remains the bearish order block on the weekly timeframe. We do not believe the current downtrend is over, as there are no signs of its completion for either Bitcoin or Ether. Currently, the second leg of the correction continues, which recently transformed into a flat. In a flat market, you can only trade from its boundaries; the subsequent direction will be determined after the flat ends. Near the upper boundary of the sideways channel ($1,800–1,942), no deviation or pattern has formed, so there are no trading signals at this time. Ether is positioned exactly in the middle of the channel.
CHOCH is a change of character / break of the trend structure. Liquidity means traders' Stop?Losses that market?makers use to build their positions. FVG is Fair Value Gap (area of price inefficiency). The price often moves quickly through such areas, indicating the absence of one side in the market. Later, the price tends to return and react to these zones. IFVG stands for Inverted Fair Value Gap. After a return to such a zone, the price does not react but impulsively breaks through and then tests it from the other side.
OB means Order Block. A candle on which a market?maker opened a position in order to harvest liquidity and then form their own position in the opposite direction.


