
See also


 07.10.2026 09:04 AM
Bitcoin trades around $84,150, down 1.7% in 24 hours. On such a sharp pullback, it becomes especially visible how price relative to purchase cost changes the position of the largest holders. In its October 5 report, Strategy valued a tax benefit of $4.1 billion after Bitcoin's fair value on September 30 rose above its average purchase price.

At the start of October, the company holds 848,000 BTC, purchased for $63.97 billion—or $75,440.7 per coin, including fees. At the current $84,150, the price is about 11.5% above the average purchase, and I estimate unrealized profit at roughly $7.4 billion. But the effect works both ways: in reports for Q1 and Q2, when costs exceeded fair value, Strategy created a reserve and wrote down the tax asset completely. If Bitcoin falls below $75,441—roughly 10% from the current price—the paper gain will likely disappear.
ETF holders sit closer to the breakeven line. The average cost of Bitcoin in BlackRock's IBIT was $81,188 per BTC as of October 2. Price is only about 3.6% above that level. Other estimates for all spot ETFs put breakevens at $81,722 and $82,225, so the corridor is roughly $81,200–$82,200.
Spot ETF flows are also telling. Since the start of the week they have lost $89.8 million.
My base case: the $81,200–$81,700 area, where ETF cost estimates converge, will be the first buyer interest zone, and I expect it to hold on the first test. While price remains above it, chances of returning to $86,000 remain, and I allow for a sideways range of roughly $82,000–$86,000 until the November 3 election. A close below $81,200 would turn the rally into a sell market for those seeking to exit at breakeven and open the way to $80,500.
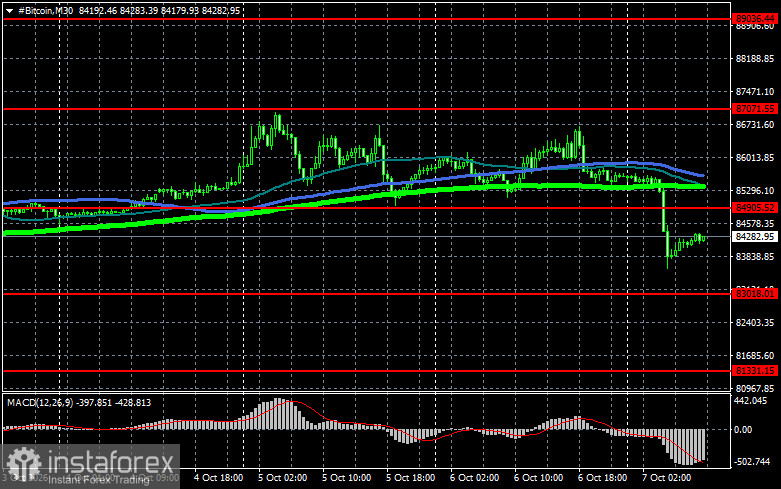
A technical picture for Bitcoin
Buyers are currently targeting a reclaim of $84,900, which would open a direct path to $87,000 and then toward $89,000; breaking $89,000 would signal attempts to restore a bull market. On the downside, buyers are expected at $83,000. A return of the instrument below that area could quickly push BTC toward $81,300. The most distant downside target is around $79,400.
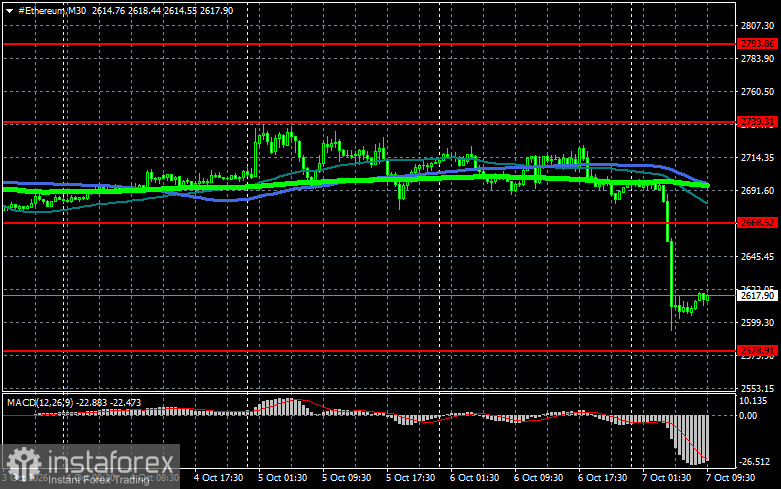
A technical picture for Ethereum
A clear hold above $2,668 would open a direct path to $2,739. The furthest upside target is the high near $2,793; breaking that level would indicate strengthening bullish sentiment and a return of buyer interest. On the downside, buyers are expected at $2,578. A return below that area could quickly push ETH toward $2,486. The most distant downside target would be around $2,433.
What we see on the chart:
- Red lines indicate support and resistance levels where either a price slowdown or active growth is expected;
- Green lines indicate the 50-day moving average;
- Blue lines indicate the 100-day moving average;
- Light green lines indicate the 200-day moving average.
A crossover, or a price test of moving averages, typically either halts the move or sparks fresh market momentum.


