Veja também

 04.06.2026 06:26 AM
In the last four trading days, Bitcoin has lost approximately $12,000 in value, with a total decline of $21,000 from its last local high. We warned that entering the liquidity pool would accelerate the drop as pending sell orders and stop-losses for bulls would start triggering. And that's exactly what happened. We have also repeatedly stated that the recent rise in Bitcoin over the past three months has been a correction and that the downward trend will resume. The signal indicating the end of the correction within the bearish Fair Value Gap (FVG) was not the most confident and unambiguous, but it was still formed.
Let's also consider the speed of movement. Bitcoin crawled upward for three months, covering a distance equal to $23,000. Since May 6 (exactly one month ago), Bitcoin has lost nearly the same amount. It is clear which of these movements is corrective and which is trend-based.
The latest drop in Bitcoin may have been triggered by several factors that do not contradict the technical picture. For instance, the company Strategy announced its first sale of Bitcoin in its history. Essentially, Michael Saylor's company sold just 32 coins of the first cryptocurrency from May 26 to May 31. This is minimal, but it sends a signal to the market: a company that has held to the principle of "never sell Bitcoin" for the past decade has renounced it. The first sale was small, but further sales could be much more significant. It is worth noting that the average purchase price of Bitcoin for Strategy is around $78,000. Thus, it is evident that all their Bitcoin investments are currently unprofitable.
Additionally, it should be noted that the chances for a resolution to the war in the Middle East have declined again. The market has long awaited positive news but has received only empty promises from Trump. US inflation is accelerating, forcing the Federal Reserve to abandon plans to ease monetary policy in 2026, a move the US president had desired. Hawkish sentiment has intensified, pressure on risk assets has increased, and spot demand was extremely low even a month or two ago, when Bitcoin showed weak growth. This combination of factors also pointed to an impending decline. However, even without these factors, Bitcoin's movements indicated that the market was preparing for a new round of the downward trend.
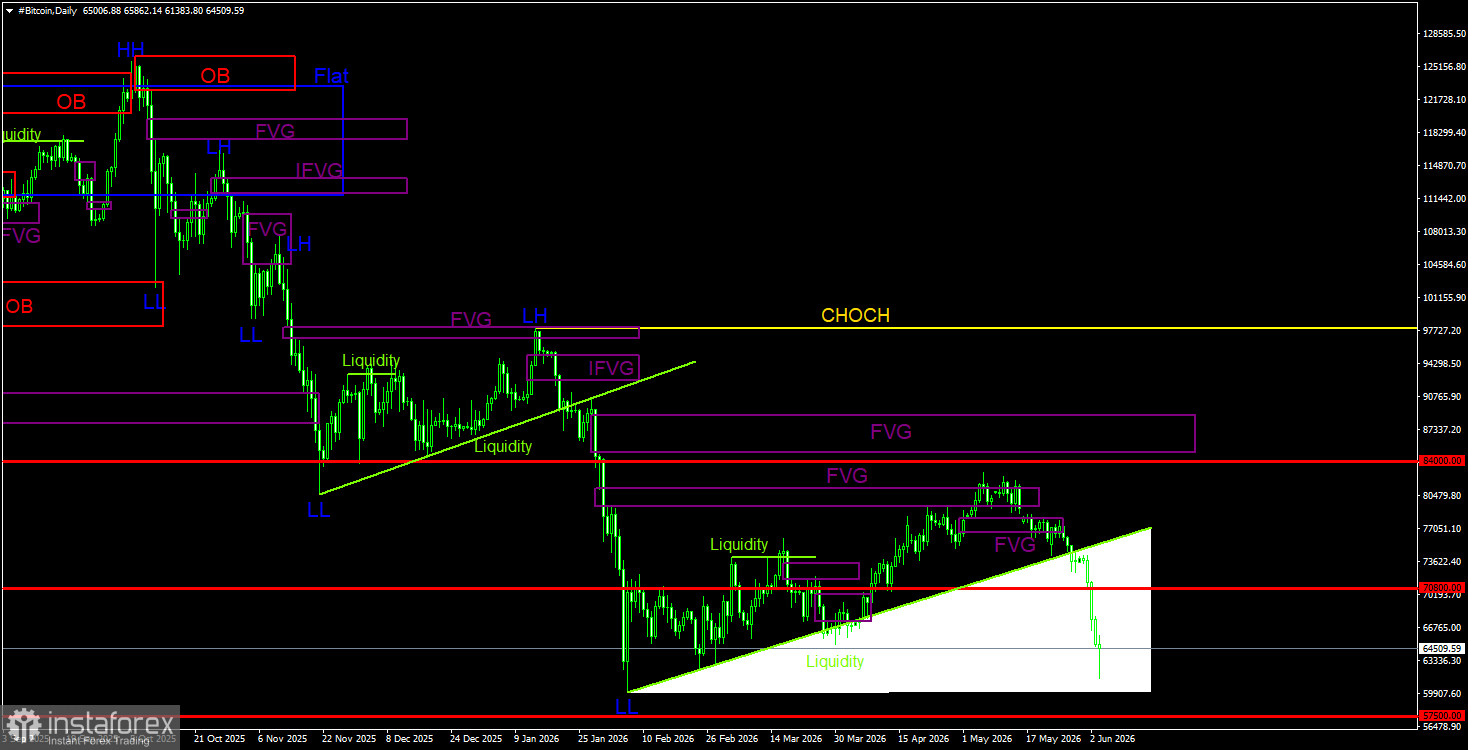
On the daily timeframe, Bitcoin has resumed forming a downward trend. The trend structure is identified as bearish, and the Change of Character (CHOCH) line remains at the level of $97,900. Only above this level can we consider the downward trend to have ended. With no signals indicating a trend reversal to the bullish side, we believe the decline will continue. A sell signal formed in the $79,500 – $81,100 range on the daily timeframe, and an upward structure was broken on the hourly timeframe, confirming the signal. The price has entered the liquidity pool, accelerating the decline. This week, new bearish FVGs are surely expected to form, allowing for new short positions to be opened. The first target remains at $57,500.
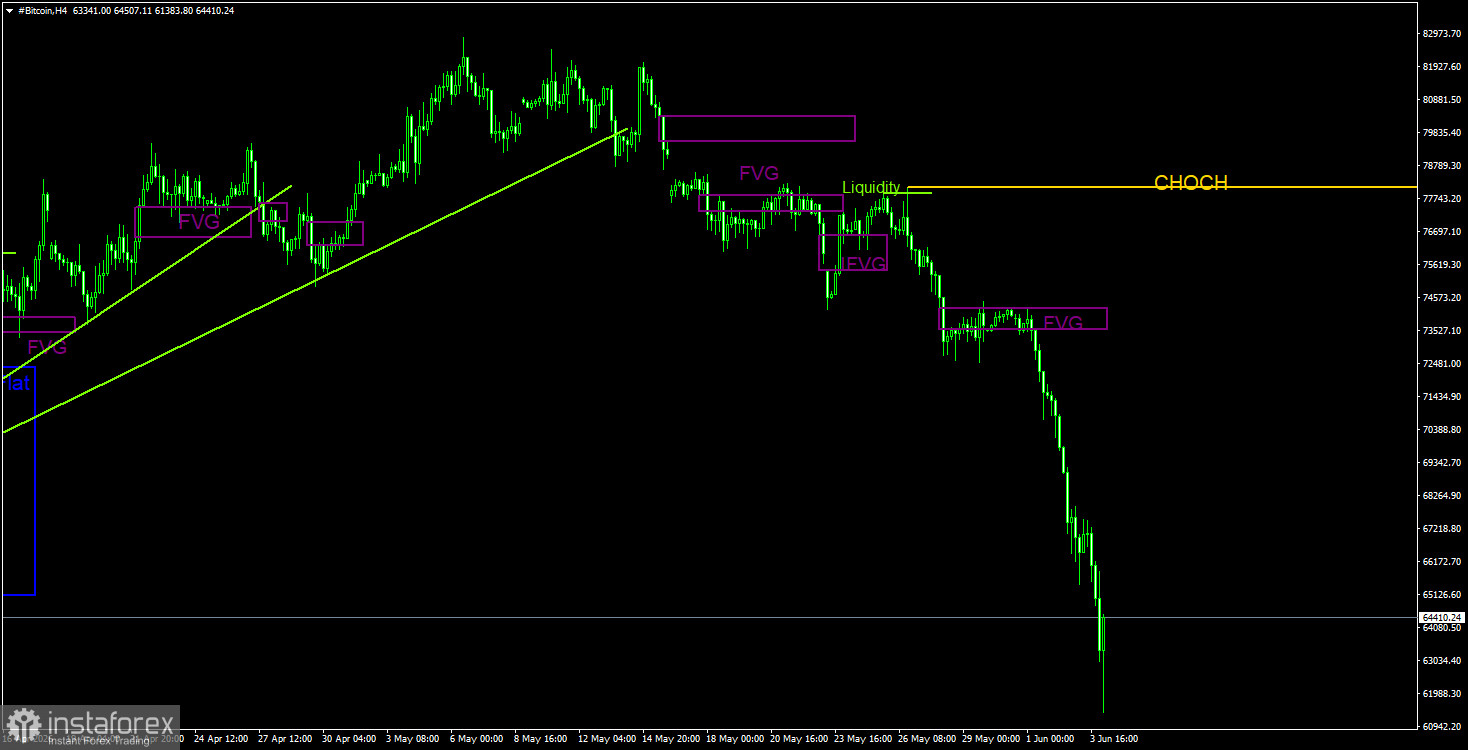
On the 4-hour timeframe, Bitcoin has transitioned from forming a downward structure to a collapse. The CHOCH line, which supports the downward trend, is at $78,000 and may shift lower in the coming days. We still see no fundamental basis for long-term strengthening of Bitcoin; spot demand remains weak. Last week, liquidity was withdrawn from the last local peak, after which a new phase of decline began. Bearish patterns can be used to open new short positions, but the decline is so strong that it is advisable to utilize the daily timeframe now.
Bitcoin continues to establish a full downward trend and correction against it. We continue to expect a decline targeting $57,500 (the 61.8% Fibonacci level from the three-year upward trend), and there are still no signs of a long-term upward trend beginning. A signal in the near-term bearish FVG on the daily timeframe located in the area of $79,300 - $81,200 has been formed and confirmed on the hourly timeframe. Thus, we are currently positioned for the continuation of the downward trend, and bearish patterns remain a priority in trading.


