See also

 22.01.2024 08:37 AM
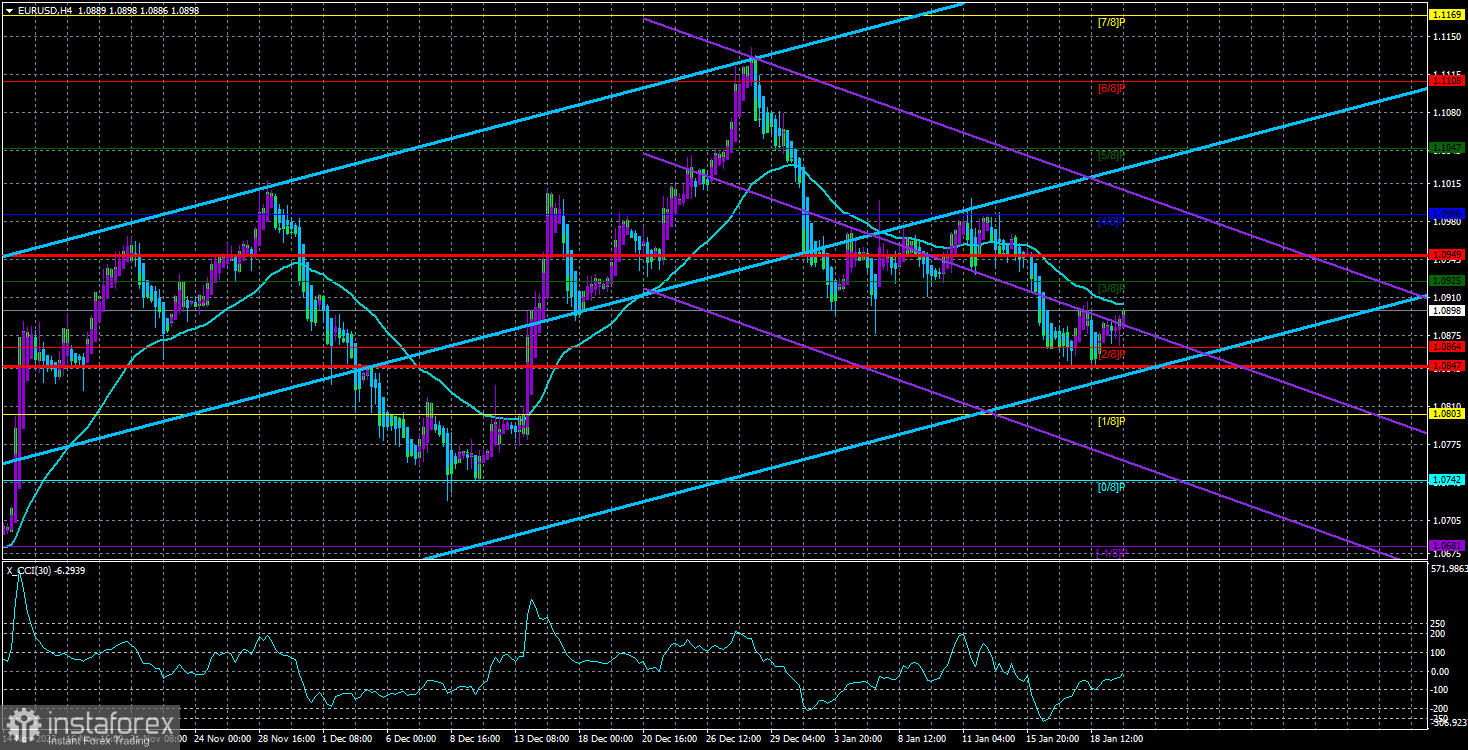
The currency pair EUR/USD showed neither interesting movements nor volatility on Friday; it showed nothing. This is quite strange because Friday was not a holiday, and several reports were published in the UK and the US while Christine Lagarde delivered a new speech in the Eurozone. Therefore, there were reasons for the market to pay attention. Although events on the week's last trading day cannot be called super important, they should have triggered some market reaction. However, the range from the day's low to the high was only 32 points.
In principle, such days happen from time to time. It is a coincidence. The technical picture has stayed the same, fundamental expectations remain the same, and the market is still interpreting macroeconomic statistics in a very one-sided manner. Many US reports that showed stronger values than expected did not properly support the dollar. This situation repeats regularly. For example, on Friday, the University of Michigan's consumer sentiment index, which was much stronger than forecasted, did not support the US currency. And this is not an isolated case.
When making trading decisions, the market still relies on its expectations regarding the ECB and the Fed interest rates. The European currency has declined in the past few weeks, but overall, the upward trend is still intact. The pair has dropped by 250 points, but it has yet to reach its last local minimum of 1.0724. Therefore, regarding the technical picture, further decline in the pair has yet to be evident.
In the 4-hour time frame, the price stays below the moving average, but let's remind ourselves that the moving average is an indicator that merely warns of a possible trend change or correction. Thus, the current downward movement could be a correction before a new rise in the European currency. Of course, we do not believe (or do not want to believe?) in such a scenario, as we have considered the rise of the euro illogical for quite some time. Moreover, we view all the upward movement of the last 3–4 months as a correction, so the main (downward) trend should resume.
If that's the case, the decline will continue, but it's worth noting that in the past year, the market bought the euro currency much more often than required. The market still believes that the Fed will start lowering interest rates in March, while the ECB will do so much later. Although the Fed's rate will remain higher than the ECB's rate for a long time, the market is only paying attention to the possible reduction of the divergence between the rates of the two regulators.
If the market believes in a certain event, it doesn't matter how things stand because the market trades based on its conclusions and forecasts.
Therefore, we expect only declines in the euro currency and believe that short positions are reasonable now. This week, we will already see the first ECB meeting, and the next will be the Fed meeting. There should be no rate changes, but Lagarde and Powell may give some hints about the regulators' plans for the year's first half. So, we shouldn't expect significant movements in the currency market until after the ECB and Fed meetings. In any case, the pound sterling has been trading in a sideways channel for more than a month.
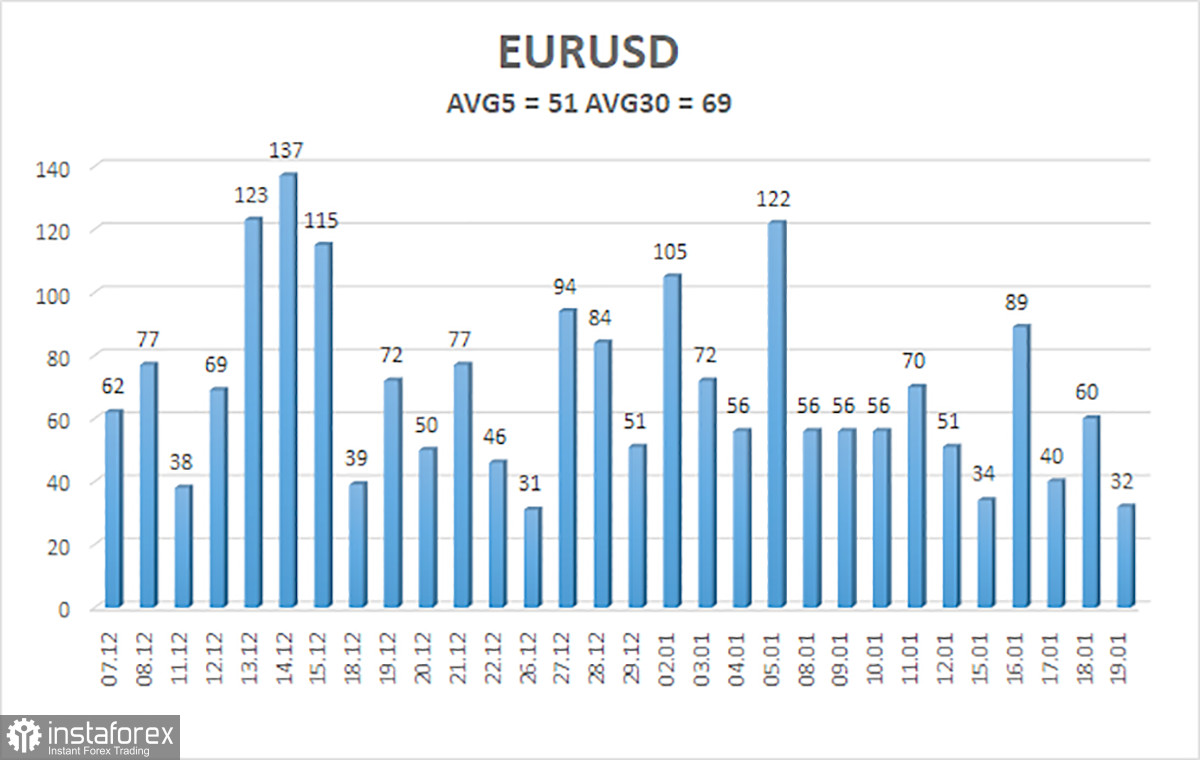
The average volatility of the EUR/USD currency pair over the last five trading days as of January 21st is 51 points and is characterized as "average." Therefore, we expect movement in the pair between the levels of 1.0847 and 1.0949 on Monday. A reversal of the Heiken Ashi indicator back down will indicate a possible resumption of the downward trend.
Nearest support levels:
S1 – 1.0864
S2 – 1.0803
S3 – 1.0742
Nearest resistance levels:
R1 – 1.0925
R2 – 1.0986
R3 – 1.1047
Explanations for the illustrations:
Linear regression channels - help determine the current trend. If both point in the same direction, the trend is currently strong.
The moving average line (settings 20.0, smoothed) - determines the short-term trend and direction in which trading should be conducted.
Murray levels - target levels for movements and corrections.
Volatility levels (red lines) - the likely price channel the pair will trade over the next day based on current volatility indicators.
CCI indicator - its entry into the overbought zone (above +250) or oversold zone (below -250) indicates an impending trend reversal in the opposite direction.


