Vea también

 16.01.2026 12:27 PM
The EUR/USD pair continued its decline on Thursday and worked through the support level of 1.1607–1.1612. A rebound from this zone today would favor the European currency and a modest rise toward the resistance level of 1.1645–1.1648. A consolidation of the pair below the 1.1607–1.1612 level would increase the probability of continued decline toward the next Fibonacci level of 76.4% at 1.1566.
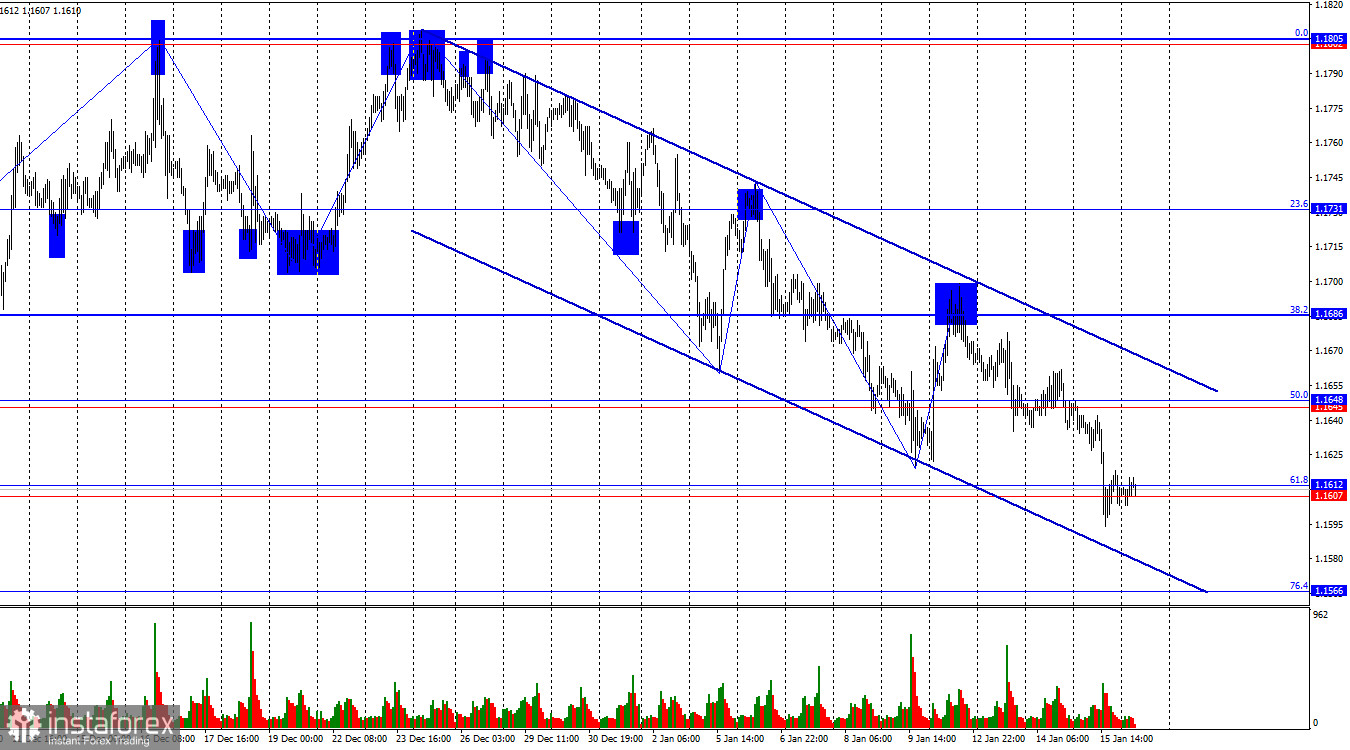
The wave situation on the hourly chart remains straightforward. The last completed upward wave failed to break the peak of the previous wave, while the most recent downward wave broke the previous low. Thus, the trend remains "bearish." In my view, the pair's decline will not be prolonged or strong, but a break of the current bearish trend is now required in order to expect a bullish advance. Based on the current chart structure, such a break would occur above the 1.1700 level.
On Thursday, bears held the advantage in the market, but had the situation been the opposite, it would not have surprised anyone either. U.S. reports were of extremely low importance to traders, yet still showed fairly solid results. Initial jobless claims came in 20,000 below expectations, while the Philadelphia Fed Business Activity Index exceeded forecasts by nearly 15 points. However, these reports were released in the second half of the day, while in the first half, Eurozone industrial production data were published and also turned out to be significantly more positive than market expectations. Annual production growth amounted to 2.5% instead of the expected 2%, and monthly growth was 1.1% instead of 0.5%. Thus, by the end of the day, bears may not necessarily have deserved to win, but at the very least, they should not have lost either. Nevertheless, the news background has recently been interpreted by traders in a very unusual and ambiguous way. As a rule, the dollar tends to win, even though many global events are working against it. Still, the downward trend channel points to the local dominance of bears.
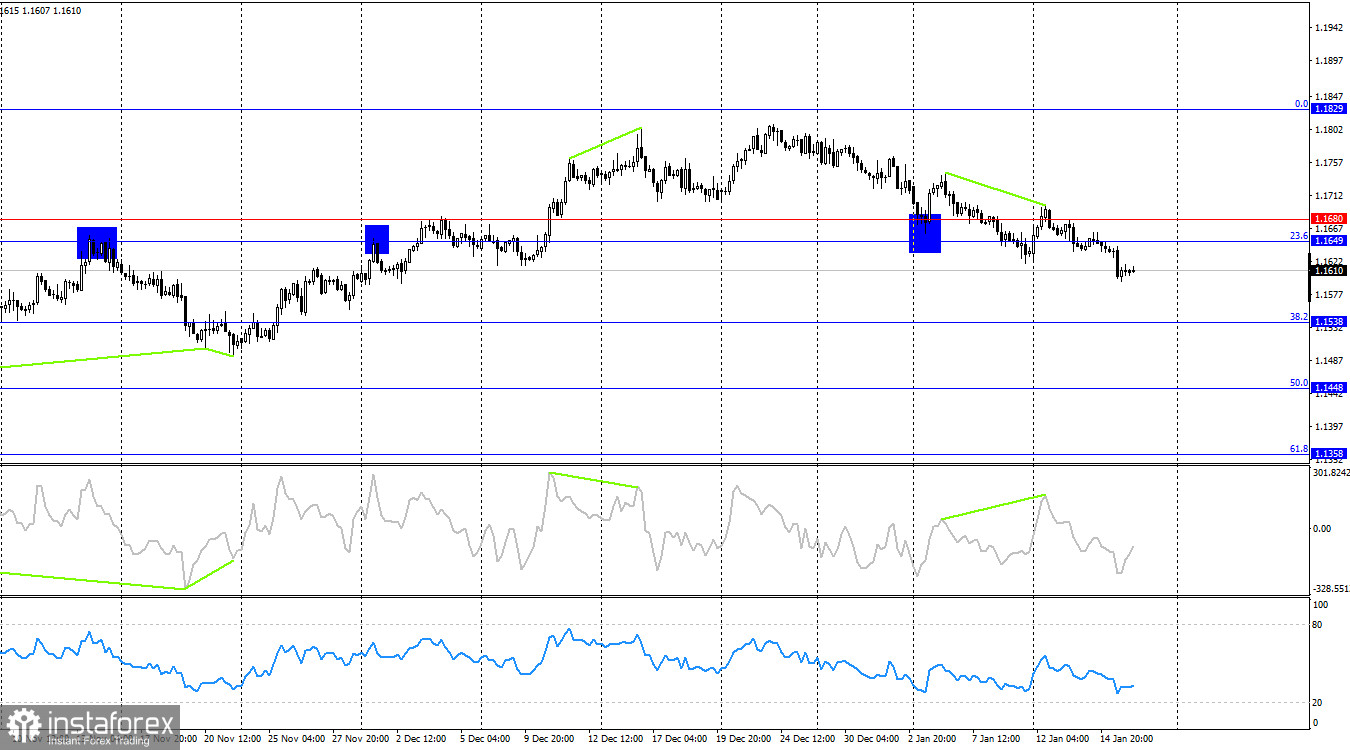
On the 4-hour chart, the pair has consolidated below the support level of 1.1649–1.1680, which allows traders to expect continued decline toward the next Fibonacci level of 38.2% at 1.1538. A bearish divergence has formed on the CCI indicator, after which a new decline in the euro began. A close above the 1.1649–1.1680 level would favor the EU currency and a resumption of growth toward the corrective level of 0.0% at 1.1829.
Commitments of Traders (COT) Report:
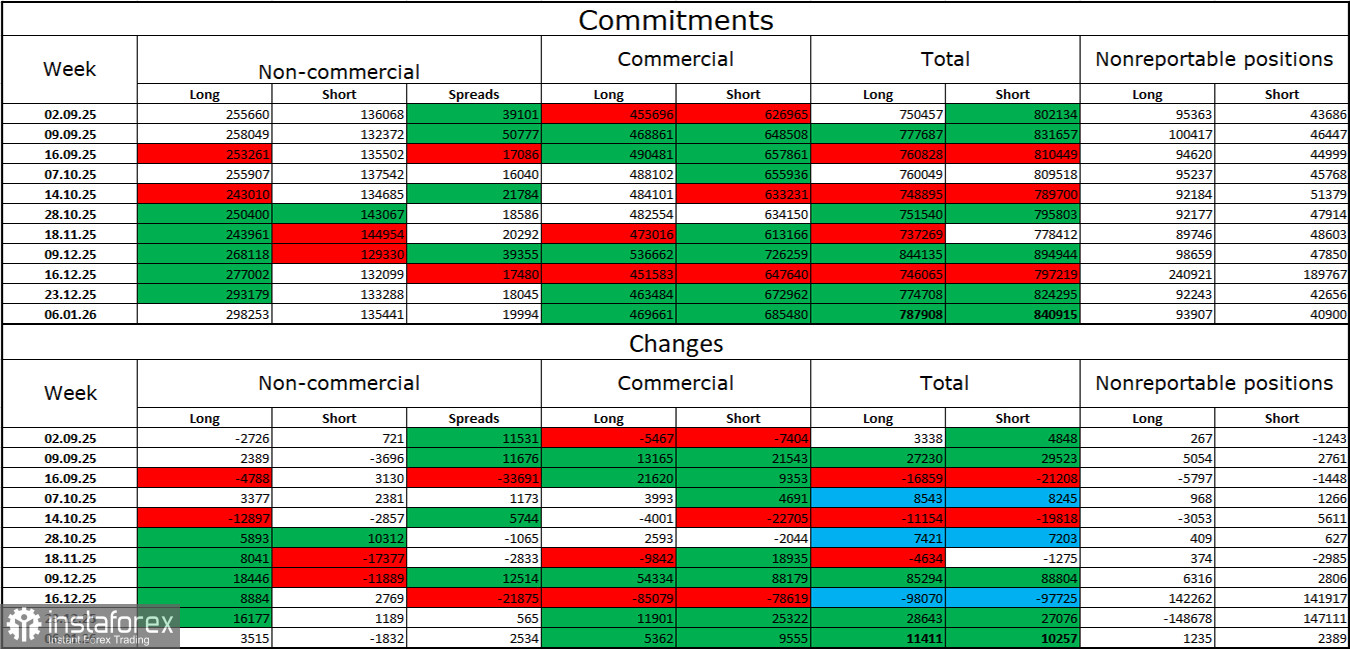
During the last reporting week, professional market participants opened 3,515 long positions and closed 1,832 short positions. Sentiment among the "Non-commercial" group remains bullish thanks to Donald Trump and his policies and continues to strengthen over time. The total number of long positions held by speculators now stands at 298,000, while short positions amount to 135,000. This represents more than a twofold advantage for bulls.
For thirty-three consecutive weeks, large players were shedding short positions and increasing long positions. Then the shutdown began, and now we are seeing the same picture again: professional traders continue to build up long positions. Donald Trump's policies remain the most significant factor for traders, as they create numerous problems that will have long-term and structural consequences for the United States—for example, deterioration in the labor market. Traders fear a loss of Federal Reserve independence in 2026 under pressure from Trump and amid the resignation of Jerome Powell.
News Calendar for the U.S. and the Eurozone:
On January 16, the economic calendar contains two entries, none of which are major. The impact of the news background on market sentiment on Friday will be extremely weak.
EUR/USD Forecast and Trading Advice:
Selling the pair was possible after a rebound from the 1.1686 level on the hourly chart with targets at 1.1648 and 1.1612. All targets have been reached. New selling is possible if the pair closes below the 1.1607–1.1612 level, with a target of 1.1566. Buying will be possible today if there is a rebound from the 1.1607–1.1612 level on the hourly chart, with a target of 1.1645–1.1648.
Fibonacci grids are drawn from 1.1492–1.1805 on the hourly chart and from 1.1066–1.1829 on the 4-hour chart.


