
Vea también


 23.10.2026 12:57 AM
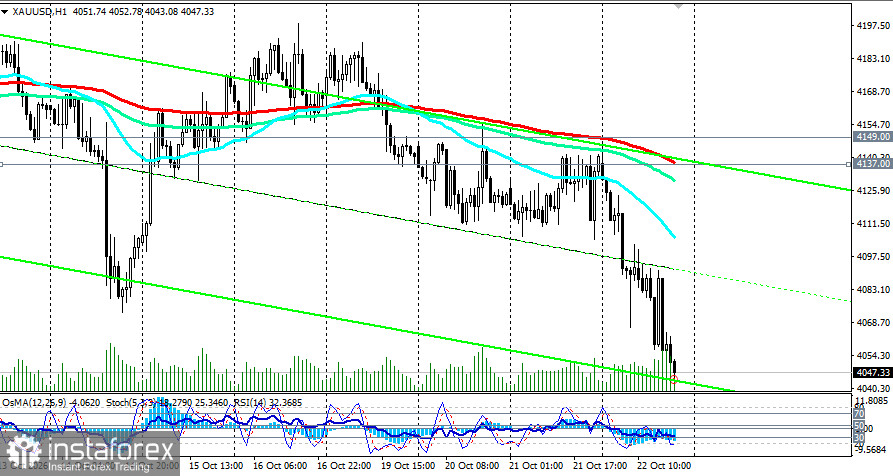
The classic logic "yields fall — gold rises" broke today. 10-year Treasuries fell below 5%, the dollar weakened, oil retreated from peaks — yet gold stubbornly moves down toward 4000.00. The reason isn't the rates themselves, but why they are falling.
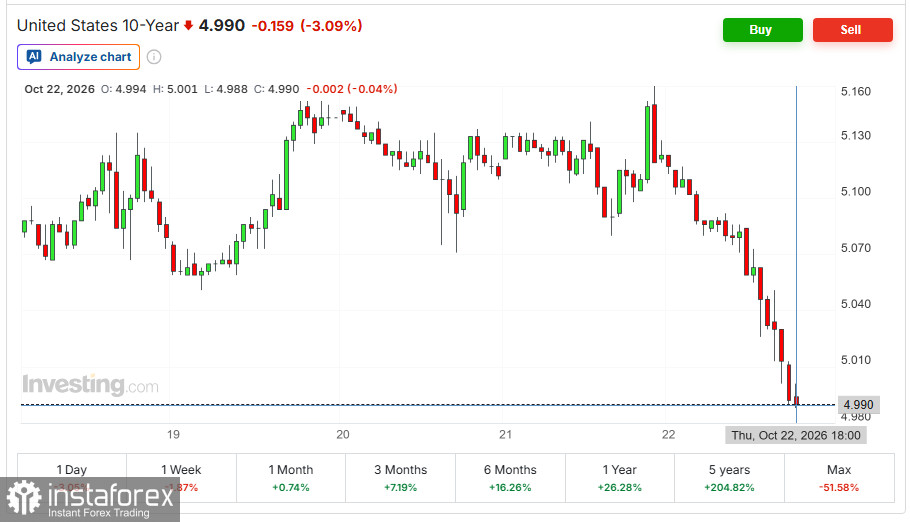
10-year U.S. Treasury yields fell below 5%, reaching about a one-month low. The dollar index (USDX) eased to 101.40, giving back part of its recent rally. WTI retreated from five-week highs to around $99, and Brent to about $108. This seems like an ideal setup for gold to recover.
But XAU/USD trades near 4045.00, marking a low not seen since early August. Silver fell below 56.00, losing roughly 5% on the day.
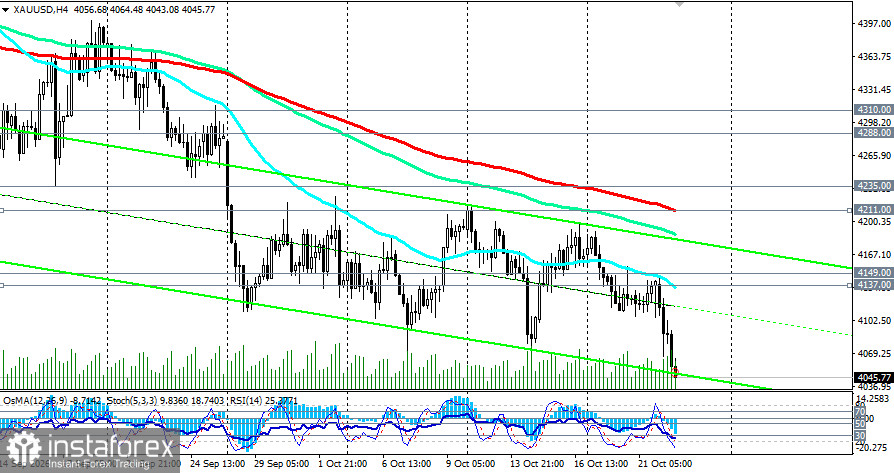
Reason one: yields are falling for the "wrong" reason. Yields are falling not because the market anticipates Federal Reserve easing, but because investors are fleeing into bonds amid a sell-off in AI stocks and fears of credit stress in the tech sector. When the flight to quality is driven by fear of credit stress rather than hope for rate cuts, gold receives no support — investors buy Treasuries, not the metal.
Reason two: the oil shock has not eased. Despite the pullback from peaks, oil remains above $99, and risks around the Strait of Hormuz and attacks on Saudi infrastructure persist. Once oil rises again, inflation expectations will return and markets will re-price a December Fed hike, currently assessed at about 76–90%. For gold, that means any recovery will meet fresh selling pressure.
Reason three: the Fed gives no reason for a turn. The market expects the Fed to hold rates at the October 27–28 meeting, but a December hike remains the base case. While that threat hangs over the market, gold cannot sustainably rally even if yields fall temporarily.
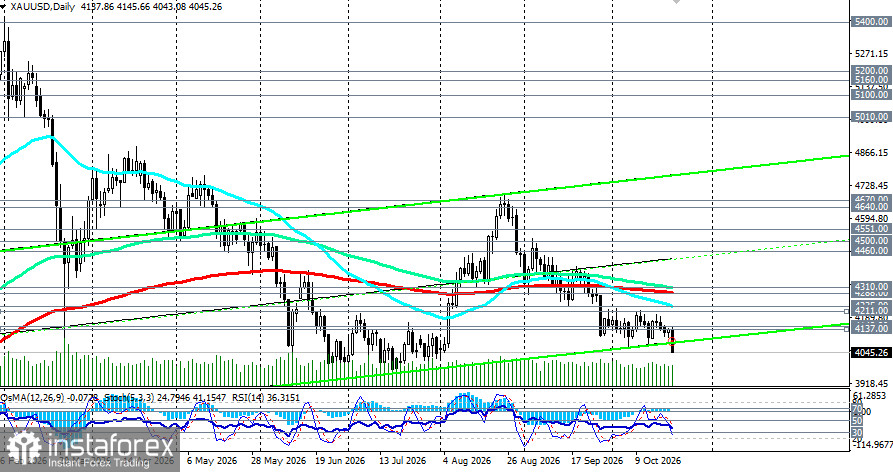
Do not buy the "dip" without confirmation. Gold has fallen for the fourth session in a row, and there are no reversal signals yet — neither technical (a close above resistance) nor fundamental (Fed rhetoric easing or a sustained drop in oil). Buying in the middle of a falling range is the most expensive way to test a reversal hypothesis.
For short-term trading: the 4040.00–4030.00 zone may provide a bounce to 4130.00, but place a strict stop below 4000.00. If price doesn't bounce from this zone within one to two sessions, that's a sign of weakness.
For medium-term investors: wait for either a close above 4150.00 (a signal that buyers are regaining control) or a pullback to 4000.00–4020.00 with subsequent confirmation of support. The October 28 FOMC meeting is the key catalyst: if the Fed signals a December pause, gold will get a powerful impulse to recover. If it confirms a hawkish stance, pressure will continue.


